
Published 2 hours ago
Binance Coin Price Prediction: Amid the recent allegation against leading crypto exchange Binance and its CEO Changpeng Zhao (CZ), the BNB price turned down from a combined resistance of a downsloping trendline and $338. Furthermore, this resistance trendline is part of a long-symmetrical triangle pattern that carries an ongoing sideways trendline. Thus, a bearish resistance from the pattern’s trendline has put the BNB price under a temporary correction.
Key points:
- A symmetrical triangle pattern governs the ongoing sideways trend in BNB price .
- A bullish breakout from the stepper resistance trendline will resume the prevailing recovery rally
- The intraday trading volume in the BNB coin is $389.5 Million, indicating an 11.2% loss
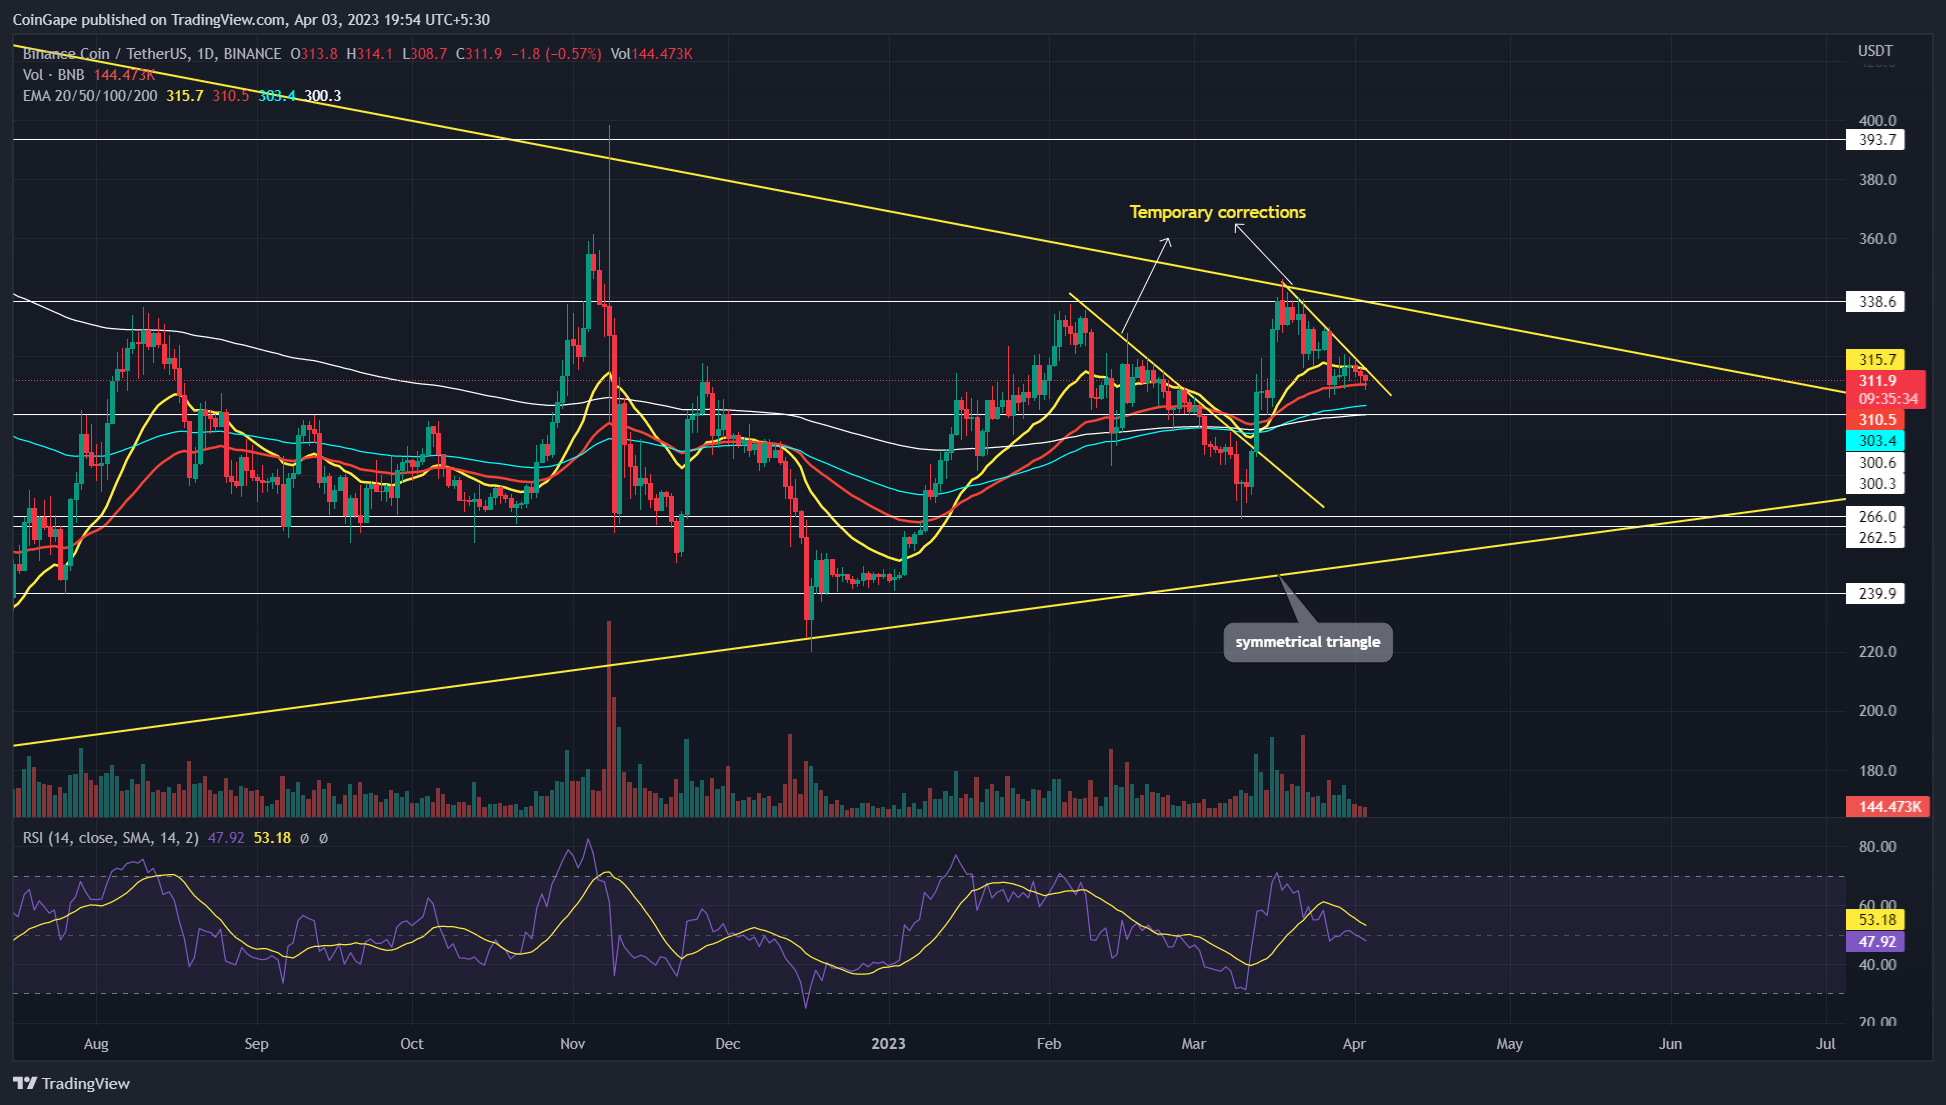
Source- Tradingview
A bearish reversal from the $338 resistance has recorded a 9% loss within the last three weeks and plunged the Binance coin price to its current price of $312. Moreover, the daily time frame chart shows the ongoing correction is led by a steeper resistance trendline assisting sellers in maintaining trend control.
Trending Stories
Thus, until this overhead trendline is intact the current correction phase will prolong for a few more trading sessions.
Also Read: Best Crypto Exchanges For Recurring Purchases In 2023
However, the decreasing volume and daily candle with lower price rejections indicate weakness in bearish momentum. Thus, this ongoing downfall may offer a pullback opportunity to traders before the uptrend resumes.
A bullish breakout from the resistance trendline will be the key signal for the end of the ongoing correction. The potential rally may surge the price 7.5% higher to rechallenge the long coming resistance trendline.
Technical Indicators
Relative strength index: the daily-RSI slope nosedived below the midline the negative sentiment in the market is rising.
EMAs: the BNB price breakdown from the 20-day EMA slope gives an additional edge to short-sellers. However, the other daily EMAs wavering just below the current price and $300 creates multiple support for buyers
Binance Coin Price Intraday Levels
- Spot rate: $311
- Trend: Bearish
- Volatility: Medium
- Resistance level- $318, $340
- Support level- $300 and $280
Share this article on:
advertisement
The presented content may include the personal opinion of the author and is subject to market condition. Do your market research before investing in cryptocurrencies. The author or the publication does not hold any responsibility for your personal financial loss.
- SEO Powered Content & PR Distribution. Get Amplified Today.
- Platoblockchain. Web3 Metaverse Intelligence. Knowledge Amplified. Access Here.
- Source: https://coingape.com/markets/binance-coin-price-prediction-volume-action-hints-bnb-price-is-under-temporary-correction-buy-again/
- :is
- 1
- 10
- 11
- 2%
- 7
- 8
- 9
- a
- Action
- Ad
- Additional
- against
- Amid
- and
- article
- At
- author
- avatar
- banner
- BE
- bearish
- Bearish Momentum
- Beauty
- before
- below
- binance
- Binance Coin
- Binance Coin Price
- blockchain
- bnb
- BNB coin
- BNB Price
- Breakdown
- breakout
- Brian
- Bullish
- buy
- by
- ceo
- Changpeng
- Changpeng Zhao
- Changpeng Zhao (CZ)
- Chart
- Coin
- Coingape
- COM
- combined
- coming
- condition
- content
- control
- correction phase
- creates
- crypto
- crypto exchange
- Crypto Exchange Binance
- Crypto Exchanges
- Crypto News
- cryptocurrencies
- cryptocurrency
- Current
- CZ
- daily
- different
- down
- downfall
- Edge
- Entertainment
- Ether (ETH)
- exchange
- Exchanges
- Fashion
- few
- finance
- financial
- follow
- For
- FRAME
- from
- Furthermore
- gives
- governs
- Have
- higher
- hints
- hold
- HOURS
- However
- HTTPS
- i
- in
- include
- Including
- index
- indicate
- indicating
- investing
- ITS
- journalism
- jpg
- Key
- Last
- leading
- Led
- Long
- loss
- Market
- market research
- million
- Momentum
- more
- Moreover
- multiple
- negative
- news
- of
- offer
- on
- ongoing
- Opinion
- Opportunity
- Other
- part
- past
- Pattern
- personal
- phase
- plato
- Plato Data Intelligence
- PlatoData
- plugin
- points
- potential
- prediction
- presented
- price
- Price Prediction
- Publication
- pullback
- purchases
- put
- rally
- Rate
- Read
- recorded
- recovery
- recurring
- research
- Resistance
- responsibility
- resume
- Reversal
- rising
- Sellers
- sentiment
- sessions
- Share
- Shows
- sideways
- Signal
- Slope
- strength
- subject
- support
- surge
- Symmetrical Triangle
- temporary
- that
- The
- three
- time
- to
- Topics
- Traders
- Trading
- Trading sessions
- trading volume
- TradingView
- Trend
- trending
- Turned
- under
- uptrend
- variety
- volume
- weakness
- Weeks
- will
- with
- within
- working
- written
- years
- Your
- zephyrnet
- Zhao