
Published 8 hours ago
Bitcoin Price Analysis: The Bitcoin price moving sideways for the past three weeks has created a sense of uncertainty in the crypto market. However, the daily chart shows the coin price is specifically resonating between two converging trend lines projecting the formation of a symmetrical triangle pattern. This well-known continuation pattern can be used to predict the most possible outcome for BTC in the coming week.
advertisement
Key Points:
- In theory, the symmetrical triangle pattern is a continuation pattern that encourages the prevailing trend once the price breaches the trendline barrier of the respective side.
- The ongoing consolidation in Bitcoin price remained above the 23.6% Fibonacci retracement level indicating the overall market trend is bullish
- The intraday trading volume in Bitcoin is $12.06 Billion, indicating a 30.5% loss.
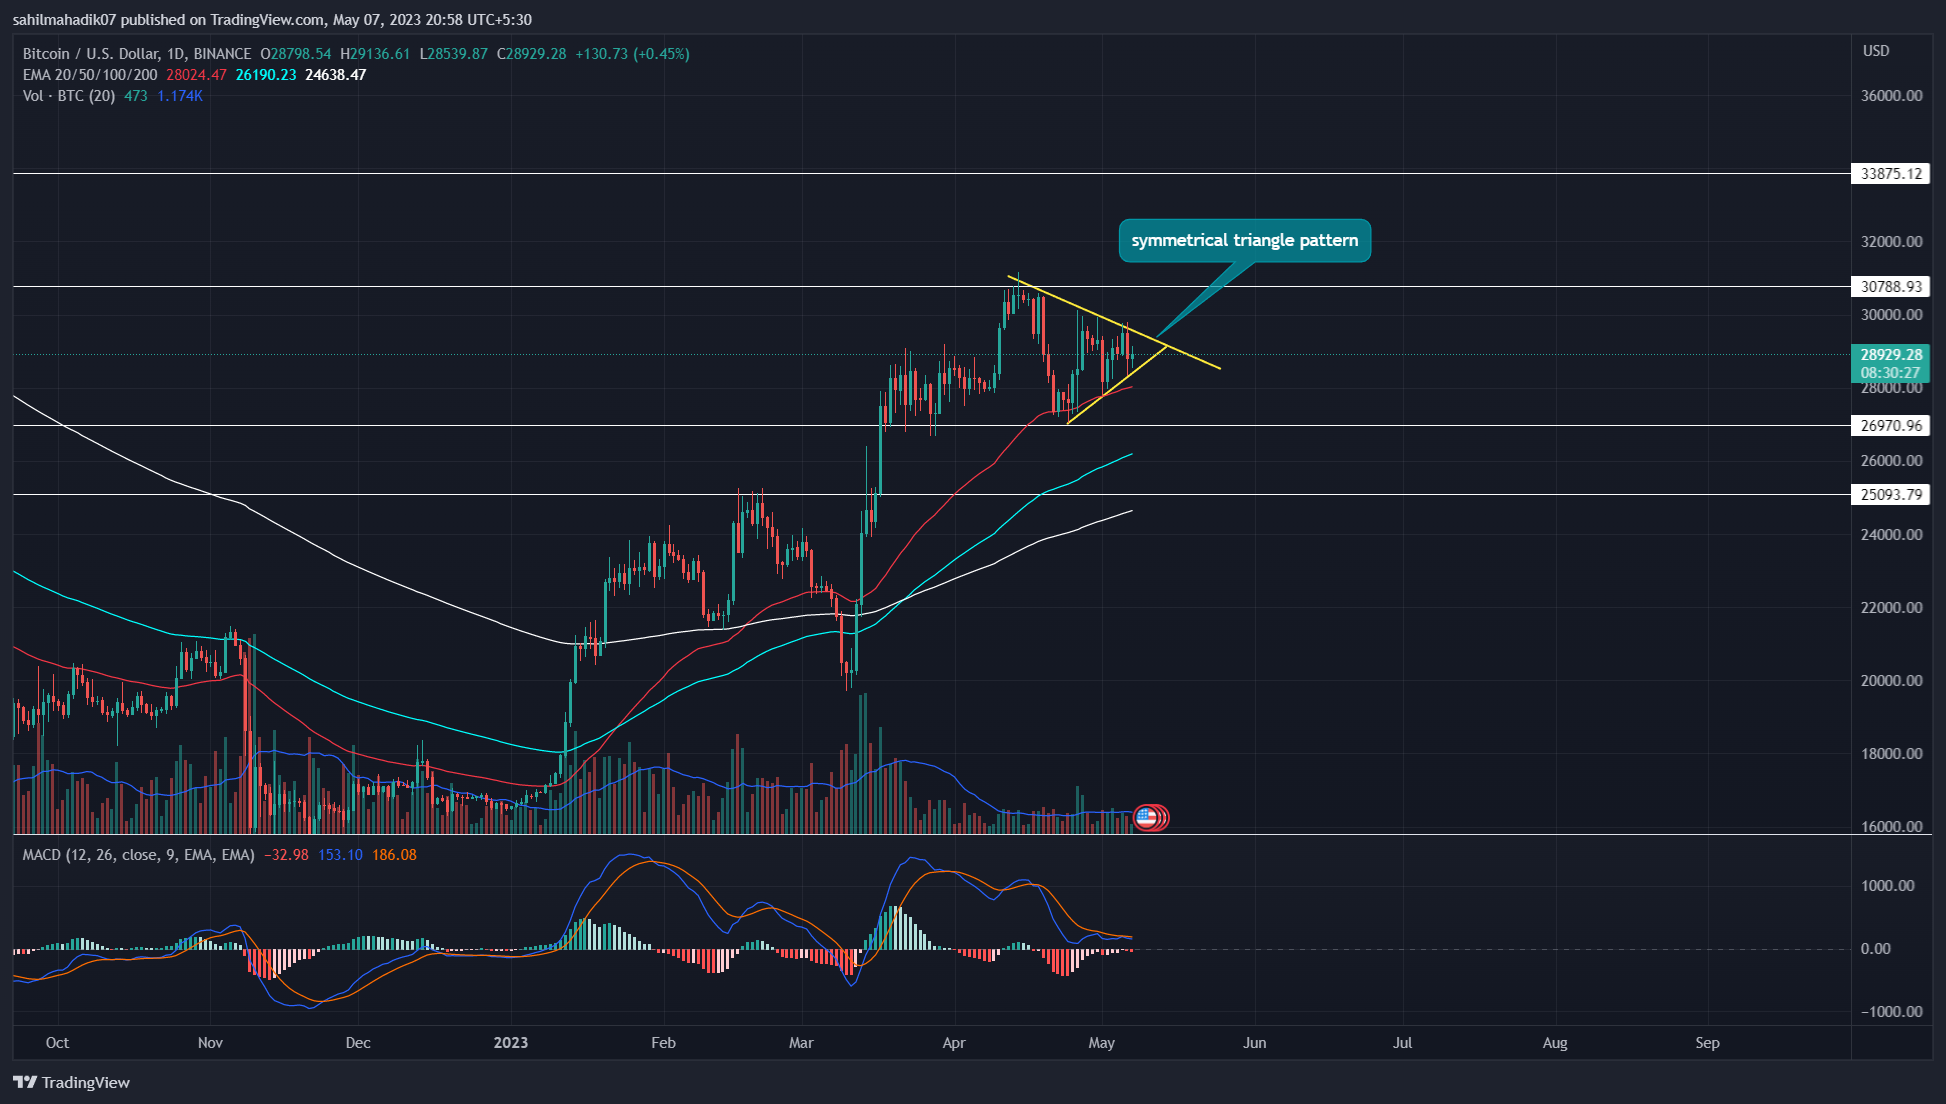
Source-Tradingview
By the press time, the Bitcoin price traded at $29035 with an intraday gain of 0.8%. With today’s jump, the coin price rebounded from the triangle pattern’s support trendline indicating the ongoing consolidation will prolong for a few more sessions.
The sideways trend will continue until the price breaks either trendline of the chart pattern. As mentioned above, the triangle pattern favors the prior price trend and thus, the bitcoin price is more likely to break the overhead trendline.
Trending Stories
A daily candle closing above the trendline will signal the resumption of a bullish recovery and offer an entry opportunity to traders. The low of the breakout candle will act as key support to put your stop loss.
Also Read: Top 10 Ways To Earn Passive Income From Crypto In 2023
Moreover, this breakout will create a high possibility for the BTC price to surpass the last swing high resistance of $30788 and hit the $34000 mark registering a growth potential of 15%.
While things look bullish for Bitcoin, a breakdown below the support trendline is possible which may undermine the bullish thesis and prolong the correction phase.
Technical Indicator
Exponential Moving Average: Dynamic support from a 50-day EMA gives an extra edge to Bitcoin buyers.
Moving Average Convergence Divergence: The falling MACD(blue) and signal(orange) went sideways above the midline suggesting an additional confirmation for bullish recovery.
Bitcoin Price Intraday Levels
- Spot rate: $29031
- Trend: Bullish
- Volatility: High
- Resistance levels- $31200 and $34600
- Support levels- $27000 and $25000
Share this article on:
advertisement
The presented content may include the personal opinion of the author and is subject to market condition. Do your market research before investing in cryptocurrencies. The author or the publication does not hold any responsibility for your personal financial loss.
- SEO Powered Content & PR Distribution. Get Amplified Today.
- PlatoAiStream. Web3 Data Intelligence. Knowledge Amplified. Access Here.
- Minting the Future w Adryenn Ashley. Access Here.
- Buy and Sell Shares in PRE-IPO Companies with PREIPO®. Access Here.
- Source: https://coingape.com/markets/bitcoin-price-analysis-guide-for-coming-week-with-potential-target-and-stoploss/
- :has
- :is
- :not
- 1
- 10
- 12
- 14
- 15%
- 20
- 23
- 30
- 7
- 8
- 9
- a
- above
- Act
- Ad
- Additional
- ago
- am
- an
- analysis
- and
- any
- article
- AS
- At
- author
- avatar
- average
- banner
- barrier
- BE
- Beauty
- before
- below
- between
- Billion
- Bitcoin
- Bitcoin News
- Bitcoin Price
- Bitcoin Price Analysis
- blockchain
- Blue
- breaches
- Break
- Breakdown
- breakout
- breaks
- Brian
- BTC
- btc price
- BTC price prediction
- Bullish
- buyers
- CAN
- Chart
- closing
- Coin
- Coingape
- COM
- coming
- condition
- confirmation
- consolidation
- content
- continuation
- continue
- Convergence
- converging
- correction phase
- create
- created
- crypto
- Crypto Market
- cryptocurrencies
- cryptocurrency
- daily
- different
- Divergence
- do
- does
- earn
- Edge
- either
- encourages
- Entertainment
- entry
- Ether (ETH)
- extra
- Falling
- Fashion
- favors
- few
- Fibonacci
- finance
- financial
- follow
- For
- formation
- from
- Gain
- gives
- Growth
- growth potential
- guide
- Have
- High
- Hit
- hold
- HOURS
- However
- HTTPS
- i
- in
- include
- Including
- Income
- indicating
- investing
- journalism
- jpg
- jump
- Key
- Last
- Level
- likely
- lines
- Look
- loss
- Low
- mark
- Market
- market research
- May..
- mentioned
- more
- most
- moving
- moving average
- news
- of
- offer
- on
- once
- ongoing
- Opinion
- Opportunity
- or
- Orange
- out
- Outcome
- overall
- passive
- passive income
- past
- Pattern
- personal
- phase
- plato
- Plato Data Intelligence
- PlatoData
- plugin
- points
- possibility
- possible
- potential
- predict
- prediction
- presented
- press
- price
- Price Analysis
- Price Prediction
- Prior
- Publication
- put
- Rate
- reach
- Read
- recovery
- registering
- remained
- research
- Resistance
- respective
- responsibility
- retracement
- sense
- sessions
- Share
- Shows
- side
- sideways
- Signal
- specifically
- Stop
- subject
- support
- surpass
- Swing
- Symmetrical Triangle
- Target
- that
- The
- thesis
- things
- this
- three
- time
- to
- today’s
- Topics
- traded
- Traders
- Trading
- trading volume
- TradingView
- Trend
- trending
- two
- Uncertainty
- Undermine
- until
- used
- variety
- volume
- ways
- week
- Weeks
- well-known
- which
- will
- with
- working
- written
- years
- Your
- zephyrnet