- In the fourth quarter, inflation in Australia hit a two-year low, coming in at 0.6%.
- Market participants have placed an almost 50% chance of the first RBA rate cut in May.
- Traders are gearing up for the conclusion of the FOMC policy meeting.
The AUD/USD forecast on Wednesday was bearish as inflation in Australia fell, increasing the likelihood of RBA rate cuts. However, the reaction to the report was little, with the currency recovering after an initial decline.
–Are you interested in learning more about ETF brokers? Check our detailed guide-
In the fourth quarter, inflation in Australia hit a two-year low, coming in at 0.6% compared to expectations of 0.8%. This will play a significant role in the RBA’s policy meeting outcome next Tuesday. Market participants have placed an almost 50% chance of the first RBA rate cut in May. This is a significant increase from 30% before the inflation report.
Meanwhile, in the US, traders are gearing up for the conclusion of the FOMC policy meeting. At the moment, traders expect the Fed to hold rates at the meeting and possibly give clues on the timing of rate cuts.
Recent data from the US, including employment and GDP, have shown a resilient economy. The most recent report on job vacancies in the US came out on Tuesday. Job vacancies rose significantly, showing a robust labor market. Therefore, the Fed still has room to hold on to high interest rates.
As a result, bets for a March rate cut have fallen significantly. Notably, interest rate futures show an almost 43% chance the Fed will cut rates starting in March. This is a big drop from the probability of 73% when the year began.
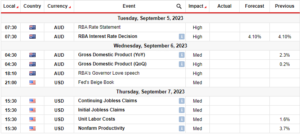
AUD/USD key events today
- US private employment change
- Federal Funds Rate
- FOMC Statement
- FOMC Press Conference
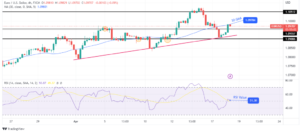
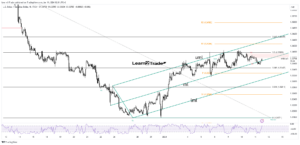
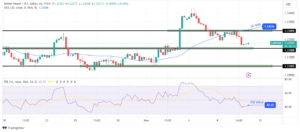
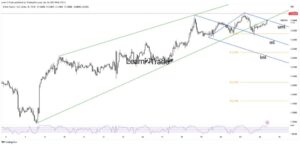
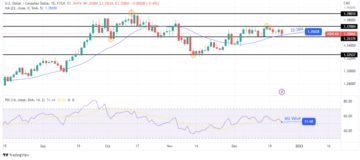
AUD/USD technical forecast: Price holds in a narrow range below 0.6625

On the charts, Aussie continues to trade in a tight range below the0.6625 key level. The price is below the 30-SMA within this tight range, meaning bears have the upper hand. Moreover, the RSI supports bearish momentum as it sits slightly below 50.
–Are you interested in learning more about Canada forex brokers? Check our detailed guide-
If bears can keep the price below the 30-SMA, it might drop further to break out of consolidation. A strong break below the 0.6550 support would signal a continuation of the previous bearish trend. However, if bears fail to make a significant swing below 0.6550, it could be a second bottom for the downtrend. This would lead to a bullish reversal.
Looking to trade forex now? Invest at eToro!
68% of retail investor accounts lose money when trading CFDs with this provider. You should consider whether you can afford to take the high risk of losing your money
- SEO Powered Content & PR Distribution. Get Amplified Today.
- PlatoData.Network Vertical Generative Ai. Empower Yourself. Access Here.
- PlatoAiStream. Web3 Intelligence. Knowledge Amplified. Access Here.
- PlatoESG. Carbon, CleanTech, Energy, Environment, Solar, Waste Management. Access Here.
- PlatoHealth. Biotech and Clinical Trials Intelligence. Access Here.
- Source: https://www.forexcrunch.com/blog/2024/01/31/aud-usd-forecast-inflation-slide-signals-potential-rba-rate-cuts/
- :has
- :is
- $UP
- 1
- 50
- a
- About
- Accounts
- After
- almost
- an
- and
- ARE
- AS
- At
- AUD/USD
- aussie
- Australia
- BE
- bearish
- Bearish Momentum
- Bears
- before
- began
- below
- Bets
- Big
- Bottom
- Break
- break out
- Bullish
- came
- CAN
- CFDs
- Chance
- Charts
- check
- coming
- compared
- conclusion
- Consider
- consolidation
- continuation
- continues
- could
- Currency
- Cut
- cuts
- data
- Decline
- detailed
- Drop
- economy
- employment
- events
- expect
- expectations
- FAIL
- Fallen
- Fed
- First
- FOMC
- FOMC policy meeting
- For
- Forecast
- forex
- Fourth
- from
- funds
- further
- Futures
- GDP
- gearing
- Give
- hand
- Have
- High
- Hit
- hold
- holds
- However
- HTTPS
- if
- in
- Including
- Increase
- increasing
- inflation
- initial
- interest
- INTEREST RATE
- Interest Rates
- interested
- Invest
- investor
- IT
- Job
- Keep
- Key
- labor
- labor market
- lead
- learning
- Level
- likelihood
- little
- lose
- losing
- Low
- make
- March
- Market
- max-width
- May..
- meaning
- meeting
- might
- moment
- Momentum
- money
- more
- Moreover
- most
- next
- notably
- now
- of
- on
- our
- out
- Outcome
- participants
- placed
- plato
- Plato Data Intelligence
- PlatoData
- Play
- policy
- possibly
- potential
- press
- previous
- price
- private
- probability
- provider
- Quarter
- range
- Rate
- Rates
- RBA
- RBA rate
- reaction
- recent
- recovering
- report
- resilient
- result
- retail
- Reversal
- Risk
- robust
- Role
- Room
- ROSE
- rsi
- Second
- should
- show
- showing
- shown
- Signal
- signals
- significant
- significantly
- sits
- Slide
- Starting
- Still
- strong
- support
- Supports
- Swing
- Take
- Technical
- The
- the Fed
- therefore
- this
- timing
- to
- trade
- Traders
- Trading
- Trend
- Tuesday
- us
- was
- Wednesday
- when
- whether
- will
- with
- within
- would
- year
- you
- Your
- zephyrnet