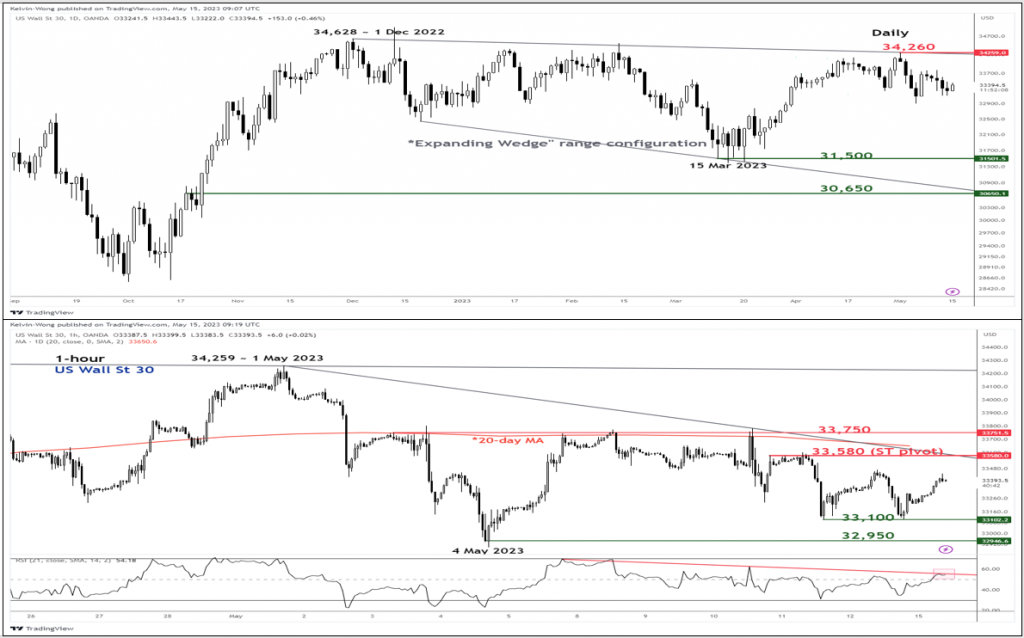
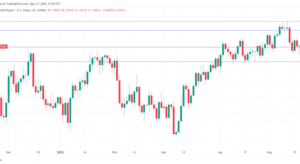
- Since its 1 December 2022 high, the Dow Jones Industrial Average has evolved into a major “Expanding Wedge” range configuration.
- In the short-term, no clear signs of upside momentum as its price actions are being capped below the 20-day moving average.
- Key short-term resistance to watch will be at 33,580.
The Dow Jones Industrial Average (DJIA) is one of the underperforming major US stock indices together with the Russell 2000 so far with a recent weekly loss of -1.11% for the week of 8 May and a 2023 year-to-date return of 0.46% against the Nasdaq 100 (+0.61%/21.94%) and S&P 500 (-0.29%/7.41%).
DJIA Technical Analysis – Potential short-term weakness below 33,580 key resistance
Fig 1: DJIA trend as of 15 May 2023 (Source: TradingView, click to enlarge chart)
Since its 1 December 2022 high of 34,628, the Indeks US Wall St 30 (proxy of the Dow Jones Industrial Average futures) has started to evolve into a major “Expanding Wedge” range configuration as depicted on the daily chart.
An important point to note is that the Dow Jones Industrial Average is one of the underperforming major US stock indices together with the Russell 2000 so far with a recent weekly loss of -1.11% for the week of 8 May and a 2023 year-to-date return of 0.46% against the Nasdaq 100 (+0.61%/21.94%) and S&P 500 (-0.29%/7.41%).
On a shorter-term frame, using the 1-hour chart, the Index has so far failed to make any headways above its slightly downward-sloping 20-day moving average now acting as a resistance at around 33,580 since the recent break below it on 2 May 2023. In addition, the 1-hour RSI oscillator has remained below a corresponding descending resistance at around the 56% level.
These observations suggest a potential build-up in short-term downside momentum. A break below minor support at 33,100 may expose the 4 May 2023 swing low area at 32,950. On the other hand, a clearance with an hourly close above the 33,580 key short-term pivotal resistance negates the bearish tone to see the next resistance coming in at 33,750 (minor swing high areas of 3 May/8 May/10 May 2023).
Vsebina je samo za splošne informacije. To ni naložbeni nasvet ali rešitev za nakup ali prodajo vrednostnih papirjev. Mnenja so avtorji; ne nujno družbe OANDA Business Information & Services, Inc. ali katere koli njene podružnice, hčerinske družbe, uradnikov ali direktorjev. Če želite reproducirati ali ponovno distribuirati katero koli vsebino, ki jo najdete na MarketPulse, nagrajeni storitvi spletnega mesta z novicami in analizami forexa, blaga in globalnih indeksov, ki jo proizvaja OANDA Business Information & Services, Inc., dostopajte do vira RSS ali nas kontaktirajte na info@marketpulse.com. Obiščite https://www.marketpulse.com/ izvedeti več o utripu svetovnih trgov. © 2023 OANDA Business Information & Services Inc.
- Distribucija vsebine in PR s pomočjo SEO. Okrepite se še danes.
- PlatoAiStream. Podatkovna inteligenca Web3. Razširjeno znanje. Dostopite tukaj.
- Kovanje prihodnosti z Adryenn Ashley. Dostopite tukaj.
- Kupujte in prodajajte delnice podjetij pred IPO s PREIPO®. Dostopite tukaj.
- vir: https://www.marketpulse.com/indices/djia-technical-capped-below-the-20-day-moving-average/kwong
- :ima
- : je
- :ne
- ][str
- 1
- 100
- 15 let
- 15%
- 2022
- 2023
- 30
- 500
- 8
- a
- O meni
- nad
- dostop
- dejavnosti
- Poleg tega
- nasveti
- podružnice
- proti
- an
- Analiza
- in
- kaj
- SE
- OBMOČJE
- območja
- okoli
- AS
- At
- Avtor
- Avtorji
- avatar
- povprečno
- Nagrada
- BE
- Medvjedast
- počutje
- spodaj
- Pasovi
- Break
- poslovni
- nakup
- by
- Graf
- jasno
- jasni znaki
- klik
- Zapri
- COM
- kombinacija
- prihajajo
- Blago
- poteka
- konfiguracija
- Povezovanje
- kontakt
- vsebina
- Ustrezno
- tečaji
- vsak dan
- december
- Direktorji
- dow
- Dow Jones
- Industrijski indeks Dow Jones
- slaba stran
- Elliott
- Povečaj
- Eter (ETH)
- razvijajo
- razvil
- Izmenjava
- izkušnje
- strokovnjak
- ni uspelo
- daleč
- finančna
- Najdi
- Pretok
- za
- tuji
- devizni
- forex
- je pokazala,
- FRAME
- Sklad
- temeljna
- Terminske pogodbe
- splošno
- Globalno
- svetovnih trgih
- strani
- visoka
- HTTPS
- if
- Pomembno
- in
- Inc
- Indeks
- indeksi
- industrijske
- Podatki
- v
- naložbe
- IT
- ITS
- Kelvin
- Ključne
- Zadnja
- Stopnja
- ravni
- kot
- off
- nizka
- Makro
- velika
- Znamka
- Tržna
- tržni obeti
- tržna raziskava
- MarketPulse
- Prisotnost
- max širine
- Maj ..
- mladoletnika
- Momentum
- več
- premikanje
- drseče povprečje
- Nasdaq
- Nasdaq 100
- nujno
- novice
- Naslednja
- št
- zdaj
- številne
- of
- uradniki
- on
- ONE
- samo
- Komentarji
- or
- Ostalo
- ven
- Outlook
- več
- strastno
- perspektive
- ključno
- platon
- Platonova podatkovna inteligenca
- PlatoData
- prosim
- Točka
- pozicioniranje
- Prispevkov
- potencial
- Cena
- Proizvedeno
- zagotavljanje
- proxy
- namene
- območje
- nedavno
- ostalo
- Raziskave
- Odpornost
- Trgovina na drobno
- vrnitev
- Razveljavitev
- RSI
- rss
- S&P
- S&P 500
- Vrednostni papirji
- glej
- prodaja
- višji
- Storitev
- Storitve
- delitev
- kratkoročno
- Znaki
- saj
- Singapur
- spletna stran
- So
- doslej
- Rešitev
- vir
- specializacijo
- začel
- zaloge
- Borzni trgi
- Strategist
- predlagajte
- podpora
- swing
- tehnični
- Tehnična analiza
- deset
- da
- O
- tisoče
- do
- skupaj
- TONE
- trgovci
- Trgovanje
- TradingView
- usposabljanje
- Trend
- edinstven
- Upside
- us
- uporabo
- v1
- obisk
- Wall
- Watch
- Wave
- šibkost
- teden
- Tedenski
- Dobro
- bo
- zmago
- z
- bi
- let
- jo
- zefirnet

