0x is an infrastructure protocol that allows users to easily trade ERC20 tokens and other assets on the Ethereum blockchain without relying on centralized intermediaries like traditional cryptocurrency exchanges.
0x achieves this decentralized exchange functionality using a collection of open-source, publicly auditable smart contracts that work together to produce a flexible, low-friction trading protocol that developers can easily weave into their products.
The protocol is powered by an ERC20 utility token known as ZRX. Nodes that (also known as relayers) host an off-chain order book and offer user-facing applications that present this information and allow users to make, fill and cancel transactions that are paid in ZRX tokens (as trading fees). ZRX can also be used to participate in platform governance, helping holders suggest and vote on changes to the protocol.
Let us look at how technical analysis for 0x looks today.
Past Performance
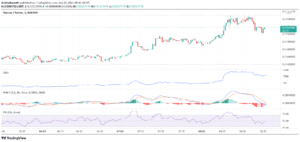
On July 3, 2021, ZRX started trading at $0.684. As of June 4, 2021, the closing price of ZRX was $0.705. Thus, in the past week, the ZRX price has increased by 3.12% and reduced by 3.42% during the last day. In the last 24 hours, 0x has traded between $0.702 – $0.709.
https://www.tradingview.com/x/Y59f4sSe/
Day Ahead And Tomorrow
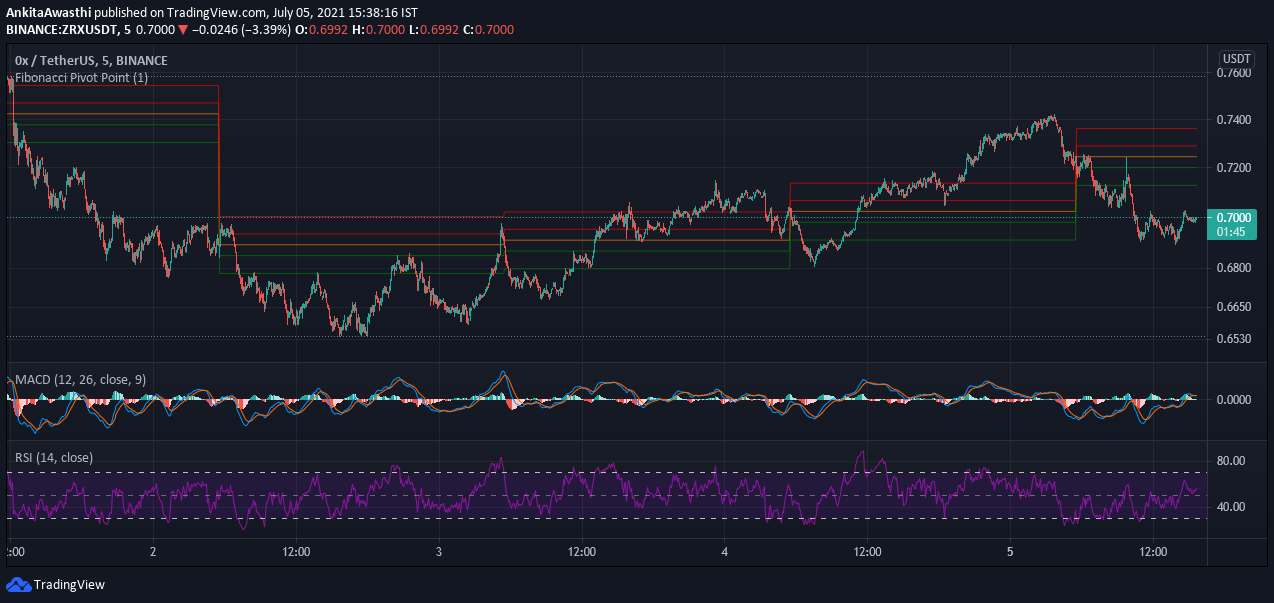
Currently, ZRX is trading at $0.702. The price has slightly reduced from the opening of $0.735. As price moved to a high and the price touched its peak at $0.743 a few hours back, fell downward and traded around $0.700.
The MACD and signal lines are near zero – a bearish crossover by the MACD line over the signal line has occurred. Thus, it looks like the ZRX price analysis is on the lower side.
The RSI indicator is at 61%. It has actually risen from the 38% mark. Thus, it indicates that the buying activity is getting activated in the market. Hence, we can expect the price to rise for some time.
The price has tested and fallen below the Fibonacci pivot point of $0.711. As some of the oscillators have shown bearish signals, we can expect the price to fall and test the first Fibonacci pivot support level of $0.697 soon.
ZRX Technical Analysis
The price has been tested and is currently trading below the 38.2% FIB retracement level of $0.714. If the price falls below the 23.6% FIB extension level of $0.705 in some time, this implies that the price downtrend is strong. In that case, the price downswing is likely to continue for a few hours.
However, if the price tests and rises above the 38.2% FIB retracement level of $0.702. It can test the 50% FIB retracement level of $0.724.
- "
- 000
- 0x
- active
- analysis
- applications
- around
- Assets
- bearish
- Bitcoin
- blockchain
- border
- BTC
- Buying
- continue
- contracts
- cryptocurrency
- Cryptocurrency Exchanges
- day
- decentralized
- Decentralized Exchange
- developers
- ERC20
- ethereum
- exchange
- Exchanges
- Fees
- Figure
- First
- governance
- High
- How
- HTTPS
- information
- Infrastructure
- IT
- jail
- July
- Level
- Line
- mark
- Market
- money
- Near
- nodes
- offer
- order
- Other
- Pivot
- platform
- Posts
- present
- price
- Price Analysis
- Products
- Share
- smart
- Smart Contracts
- started
- support
- Technical
- Technical Analysis
- test
- tests
- time
- token
- Tokens
- trade
- Trading
- Transactions
- us
- users
- utility
- Utility Token
- Vote
- Weave
- Work
- zero