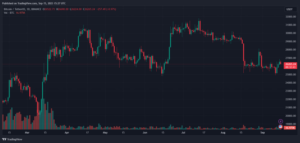
Ripple is struggling to recover above the $0.48 resistance against the US Dollar. XRP price could extend losses if there is a close below the $0.44 support.
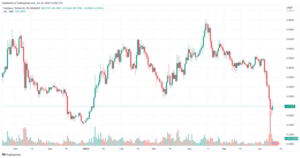
- Ripple started a fresh decline from the $0.500 zone against the US dollar.
- The price is now trading below $0.488 and the 100 simple moving average (4 hours).
- There is a key bearish trend line forming with resistance near $0.470 on the 4-hour chart of the XRP/USD pair (data source from Kraken).
- The pair might decline further if it stays below the $0.488 and $0.500 resistance levels.
Ripple Price Faces Hurdles
After a minor upward move, Ripple’s XRP struggled to gain pace for a move above the $0.50 resistance against the US Dollar. A high is formed near $0.4868 and the price is moving lower, similar to Bitcoin and Ethereum.
There was a clear move below the $0.475 and $0.470 support levels. The price is now trading near the 50% Fib retracement level of the upward move from the $0.4332 swing low to the $0.4868 high. It is now trading below $0.488 and the 100 simple moving average (4 hours).
Initial resistance is near the $0.470 zone. There is also a key bearish trend line forming with resistance near $0.470 on the 4-hour chart of the XRP/USD pair.

Source: XRPUSD on TradingView.com
The first major resistance is near the $0.480 level or the 100 simple moving average (4 hours). The main resistance is near the $0.488 level. A successful break above the $0.480 and $0.488 resistance levels might send the price toward the $0.520 resistance. Any more gains might send the price toward the $0.535 resistance.
More Losses in XRP?
If ripple fails to clear the $0.480 resistance zone, it could continue to move down. Initial support on the downside is near the $0.454 zone or the 61.8% Fib retracement level of the upward move from the $0.4332 swing low to the $0.4868 high.
The next major support is near $0.440. If there is a downside break and a close below the $0.440 level, XRP’s price could extend losses. In the stated case, the price could test the $0.400 support zone.
Technical Indicators
4-Hours MACD – The MACD for XRP/USD is now gaining pace in the bearish zone.
4-Hours RSI (Relative Strength Index) – The RSI for XRP/USD is now below the 50 level.
Major Support Levels – $0.454, $0.440, and $0.400.
Major Resistance Levels – $0.480, $0.488, and $0.500.
- SEO Powered Content & PR Distribution. Get Amplified Today.
- PlatoAiStream. Web3 Data Intelligence. Knowledge Amplified. Access Here.
- Minting the Future w Adryenn Ashley. Access Here.
- Source: https://www.newsbtc.com/analysis/xrp/xrp-price-prediction-ripple-0-4-2/
- :is
- 100
- 50
- 500
- a
- above
- against
- also
- and
- any
- AS
- average
- bearish
- Bears
- below
- Break
- case
- Chart
- clear
- Close
- continue
- could
- data
- Decline
- Dollar
- down
- downside
- extend
- faces
- fails
- First
- For
- formed
- fresh
- from
- further
- Gain
- gaining
- Gains
- High
- HOURS
- HTTPS
- if
- in
- index
- initial
- IT
- Key
- Kraken
- Level
- levels
- Line
- losses
- Low
- Lows
- MACD
- Main
- major
- max-width
- might
- minor
- more
- move
- moving
- moving average
- Near
- NewsBTC
- next
- now
- of
- on
- or
- Pace
- plato
- Plato Data Intelligence
- PlatoData
- prediction
- price
- Price Prediction
- Recover
- relative strength index
- Resistance
- retracement
- Ripple
- rsi
- send
- sentiment
- similar
- Simple
- Source
- started
- stated
- strength
- Struggling
- successful
- support
- support levels
- Swing
- Target
- test
- The
- There.
- to
- toward
- Trading
- TradingView
- Trend
- upward
- us
- US Dollar
- was
- with
- xrp
- XRP Price
- XRP price prediction
- XRP/USD
- zephyrnet