XRP price started a fresh decline from the $0.550 resistance against the US Dollar. It could accelerate lower and revisit the $0.45 support.
- Ripple’s token price is declining from the 0.550 resistance against the US dollar.
- The price is now trading above $0.500 and the 100 simple moving average (4 hours).
- There is a major bearish trend line forming with resistance near $0.5065 on the 4-hour chart of the XRP/USD pair (data source from Kraken).
- The pair might continue to move down if it breaks the $0.488 support zone.
XRP Price Takes Hit
Recently, XRP made another attempt to clear the $0.550 resistance. However, the bulls failed to clear the $0.550 barrier. The price traded as high as $0.5510 and started a fresh decline, like Bitcoin and Ethereum.
There was a steady decline below the $0.532 and $0.525 levels. The price even declined below the $0.50 level and the 100 simple moving average (4 hours). Finally, it retested the $0.488 support zone. A low is formed near $0.4875 and the price is now consolidating losses.
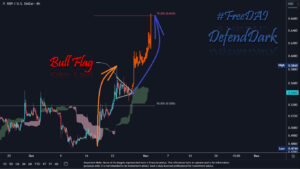
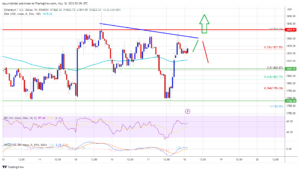
XRP is now trading above $0.500 and the 100 simple moving average (4 hours). There is also a major bearish trend line forming with resistance near $0.5065 on the 4-hour chart of the XRP/USD pair. The trend line is near the 23.6% Fib retracement level of the recent decline from the $0.5510 swing high to the $0.4875 low.
On the upside, immediate resistance is near the $0.505 level and the trend line. A close above the $0.505 level could send the price toward the $0.525 resistance or the 61.8% Fib retracement level of the recent decline from the $0.5510 swing high to the $0.4875 low.

Source: XRPUSD on TradingView.com
A successful break above the $0.525 resistance level might start a strong increase toward the $0.550 resistance. Any more gains might send XRP toward the $0.580 resistance.
More Losses?
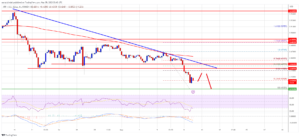
If XRP fails to clear the $0.505 resistance zone, it could continue to move down. Initial support on the downside is near the $0.488 zone.
The next major support is at $0.450. If there is a downside break and a close below the $0.450 level, XRP price might turn red. In the stated case, the price could retest the $0.420 support zone.
Technical Indicators
4-Hours MACD – The MACD for XRP/USD is now losing pace in the bearish zone.
4-Hours RSI (Relative Strength Index) – The RSI for XRP/USD is now below the 50 level.
Major Support Levels – $0.488, $0.465, and $0.450.
Major Resistance Levels – $0.505, $0.525, and $0.550.
- SEO Powered Content & PR Distribution. Get Amplified Today.
- PlatoData.Network Vertical Generative Ai. Empower Yourself. Access Here.
- PlatoAiStream. Web3 Intelligence. Knowledge Amplified. Access Here.
- PlatoESG. Carbon, CleanTech, Energy, Environment, Solar, Waste Management. Access Here.
- PlatoHealth. Biotech and Clinical Trials Intelligence. Access Here.
- Source: https://www.newsbtc.com/analysis/xrp/xrp-price-prediction-plunge-to-0-45/
- :is
- 1
- 100
- 23
- 420
- 50
- 500
- a
- above
- accelerate
- against
- also
- and
- Another
- any
- AS
- At
- attempt
- average
- barrier
- bearish
- below
- Break
- breaks
- Bulls
- case
- Chart
- clear
- Close
- consolidating
- continue
- could
- data
- Decline
- Declining
- Dollar
- down
- downside
- Even
- Failed
- fails
- Finally
- For
- formed
- fresh
- from
- Gains
- High
- horizon
- HOURS
- However
- HTTPS
- if
- immediate
- in
- Increase
- index
- initial
- IT
- Kraken
- Level
- levels
- like
- Line
- losing
- losses
- Low
- lower
- MACD
- made
- major
- max-width
- might
- more
- move
- moving
- moving average
- Near
- NewsBTC
- next
- now
- of
- on
- or
- Pace
- pair
- plato
- Plato Data Intelligence
- PlatoData
- plunge
- prediction
- price
- Price Prediction
- recent
- Red
- relative
- relative strength index
- Resistance
- retracement
- rsi
- send
- Simple
- Source
- start
- started
- stated
- steady
- strength
- strong
- successful
- support
- support levels
- Swing
- takes
- The
- There.
- to
- token
- toward
- traded
- Trading
- TradingView
- Trend
- TURN
- Upside
- us
- US Dollar
- was
- why
- with
- xrp
- XRP Price
- XRP price prediction
- XRP/USD
- zephyrnet