- XRP price started a fresh decline below the $0.620 zone against the US dollar.
- The price is now trading below $0.600 and the 55 simple moving average (4 hours).
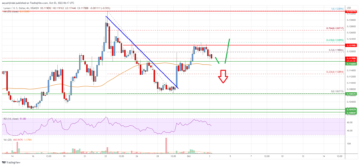
- There was a break below a key rising channel with support at $0.6125 on the 4-hour chart of the XRP/USD pair (data source from Bittrex).
- The pair could extend losses if it breaks the $0.588 support zone.
XRP price is struggling below $0.620 against the US Dollar, unlike Bitcoin. The price could decline further if it settles below the $0.588 support in the near term.
XRP Price Analysis
In the past few days, Ripple’s XRP price started a fresh decline from well above $0.650 against the US Dollar. The XRP/USD pair gained bearish momentum below the $0.620 level.
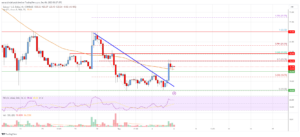
The bears were able to push the price below the $0.600 support. It even traded below the 55 simple moving average (4 hours) and spiked below the $0.588 support. A low was formed near $0.5723 before there was an upside correction.
However, the price struggled near $0.6385 and is now moving lower. There was a break below a key rising channel with support at $0.6125 on the 4-hour chart of the XRP/USD pair.
XRP is now trading below $0.600 and the 55 simple moving average (4 hours). Initial support on the downside is near $0.605. It is close to the 50% Fib retracement level of the upward move from the $0.5732 swing low to the $0.6385 high.
The next major support is near the $0.588 level or the 76.4% Fib retracement level of the upward move from the $0.5732 swing low to the $0.6385 high. Any more losses could lead the price toward the $0.550 level, below which the price might even test $0.520.
On the upside, the price is facing resistance near $0.620. The next major resistance is near the $0.635 level. A clear move above $0.635 might start a fresh increase. In the stated case, the price could even surpass the $0.650 resistance. Any more gains might send the price toward the $0.785 resistance.
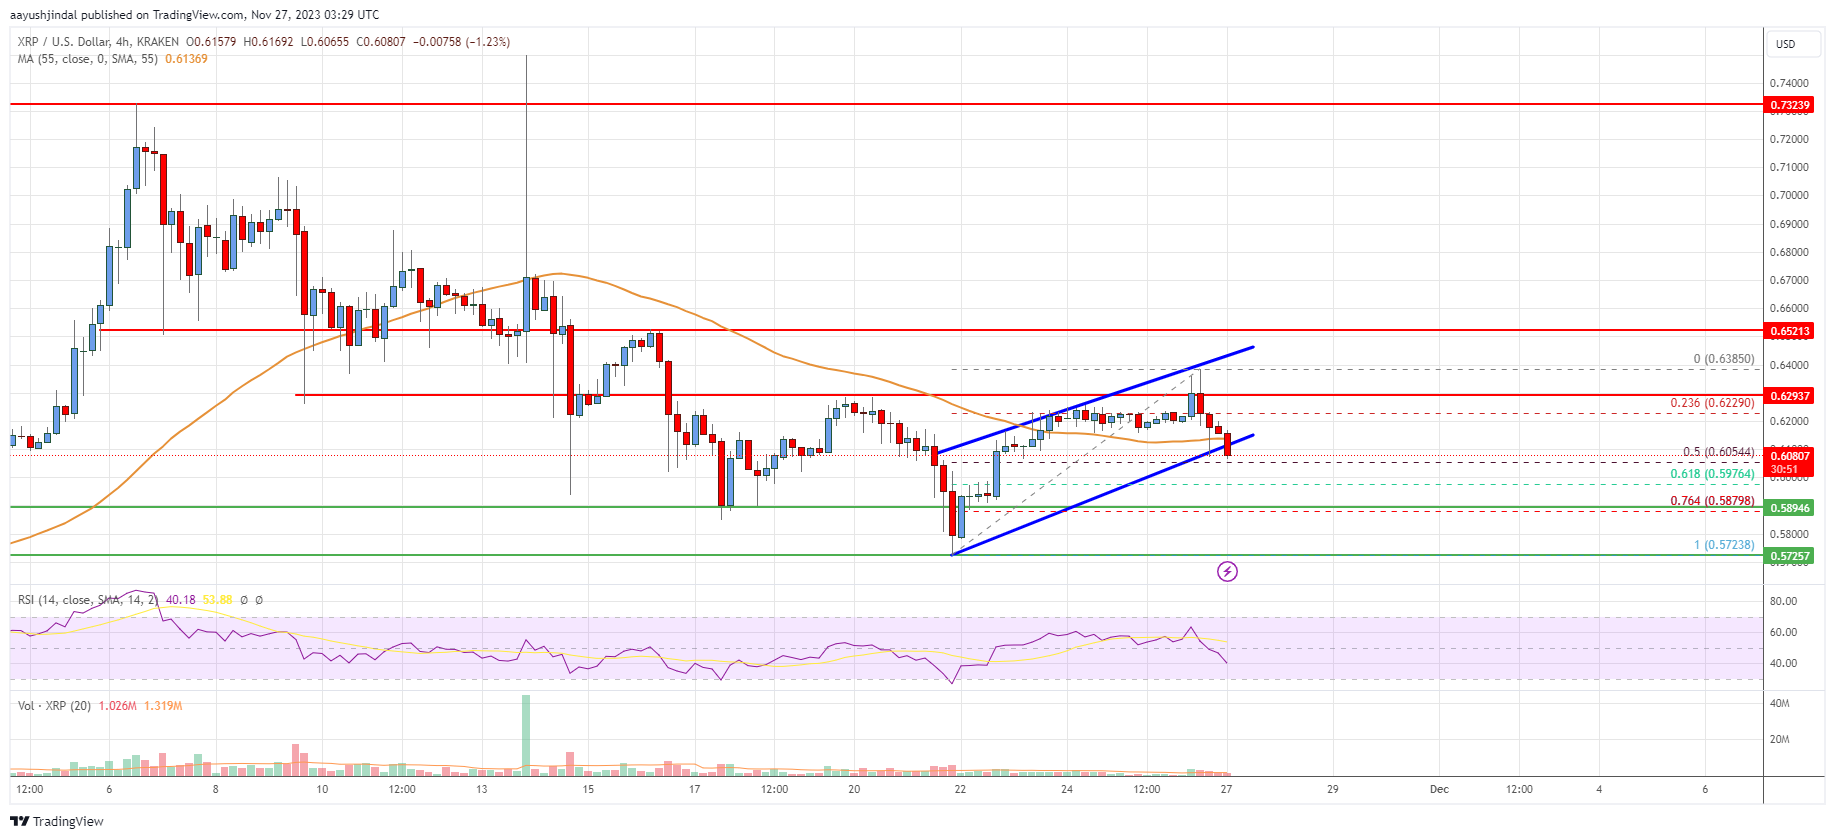
Looking at the chart, XRP price is now trading below the $0.620 zone and the 55 simple moving average (4 hours). Overall, the price could extend losses if it breaks the $0.588 support zone.
Technical indicators
4 hours MACD – The MACD for XRP/USD is now gaining momentum in the bearish zone.
4 hours RSI (Relative Strength Index) – The RSI for XRP/USD is below the 50 level.
Key Support Levels – $0.605, $0.588, and $0.550.
Key Resistance Levels – $0.620 and $0.635.
- SEO Powered Content & PR Distribution. Get Amplified Today.
- PlatoData.Network Vertical Generative Ai. Empower Yourself. Access Here.
- PlatoAiStream. Web3 Intelligence. Knowledge Amplified. Access Here.
- PlatoESG. Carbon, CleanTech, Energy, Environment, Solar, Waste Management. Access Here.
- PlatoHealth. Biotech and Clinical Trials Intelligence. Access Here.
- Source: https://www.livebitcoinnews.com/xrp-price-analysis-xrp-at-risk-of-drop-toward-0-50/
- :is
- 50
- 521
- a
- Able
- above
- against
- an
- analysis
- and
- any
- At
- average
- bearish
- Bearish Momentum
- Bears
- before
- below
- Bitcoin
- Bitcoin News
- bittrex
- Break
- breaks
- case
- Channel
- Chart
- clear
- Close
- could
- data
- Days
- Decline
- Dollar
- downside
- Drop
- Even
- extend
- facing
- few
- For
- formed
- fresh
- fresh increase
- from
- further
- gained
- gaining
- Gains
- High
- HOURS
- HTTPS
- if
- in
- Increase
- index
- initial
- IT
- Key
- lead
- Level
- levels
- live
- Live Bitcoin News
- losses
- Low
- lower
- MACD
- major
- max-width
- might
- Momentum
- more
- move
- moving
- moving average
- Near
- news
- next
- now
- of
- on
- or
- overall
- pair
- past
- plato
- Plato Data Intelligence
- PlatoData
- price
- Price Analysis
- Push
- relative
- relative strength index
- Resistance
- retracement
- rising
- Risk
- rsi
- send
- settles
- Simple
- Source
- start
- started
- stated
- strength
- Struggling
- support
- support levels
- surpass
- Swing
- term
- test
- The
- There.
- to
- toward
- traded
- Trading
- TradingView
- unlike
- Upside
- upward
- us
- US Dollar
- was
- WELL
- were
- which
- with
- xrp
- XRP Price
- XRP price analysis
- XRP/USD
- zephyrnet