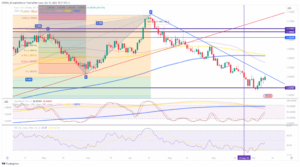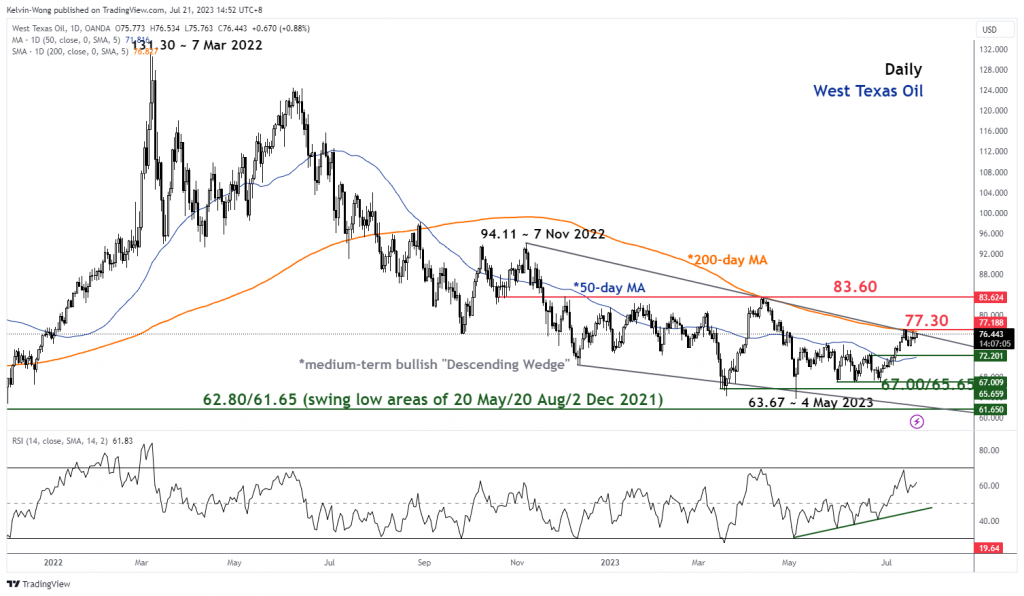
- Major downtrend phase from the 7 March 2022 swing high has evolved into a potential bullish reversal “Descending Wedge” configuration.
- US$77.30 is the key intermediate resistance (200-day moving average & upper boundary of “Descending Wedge”).
- Key short-term support rests at US$72.20, also the 50-day moving average.
Since its 7 Nov 2020 medium-term swing high of US$94.11 per barrel, the price actions of West Texas Oil (a proxy of WTI crude oil futures) have been oscillating within an 8-month bullish “Descending Wedge” configuration which suggests a potential major bullish reversal configuration in the process since its major downtrend phase from 7 March 2022 high of US$131.30 to 4 May 2023 low of US$63.67 that recorded a loss of -51.5%.
Major downtrend phase has evolved into a potential bullish reversal “Descending Wedge”
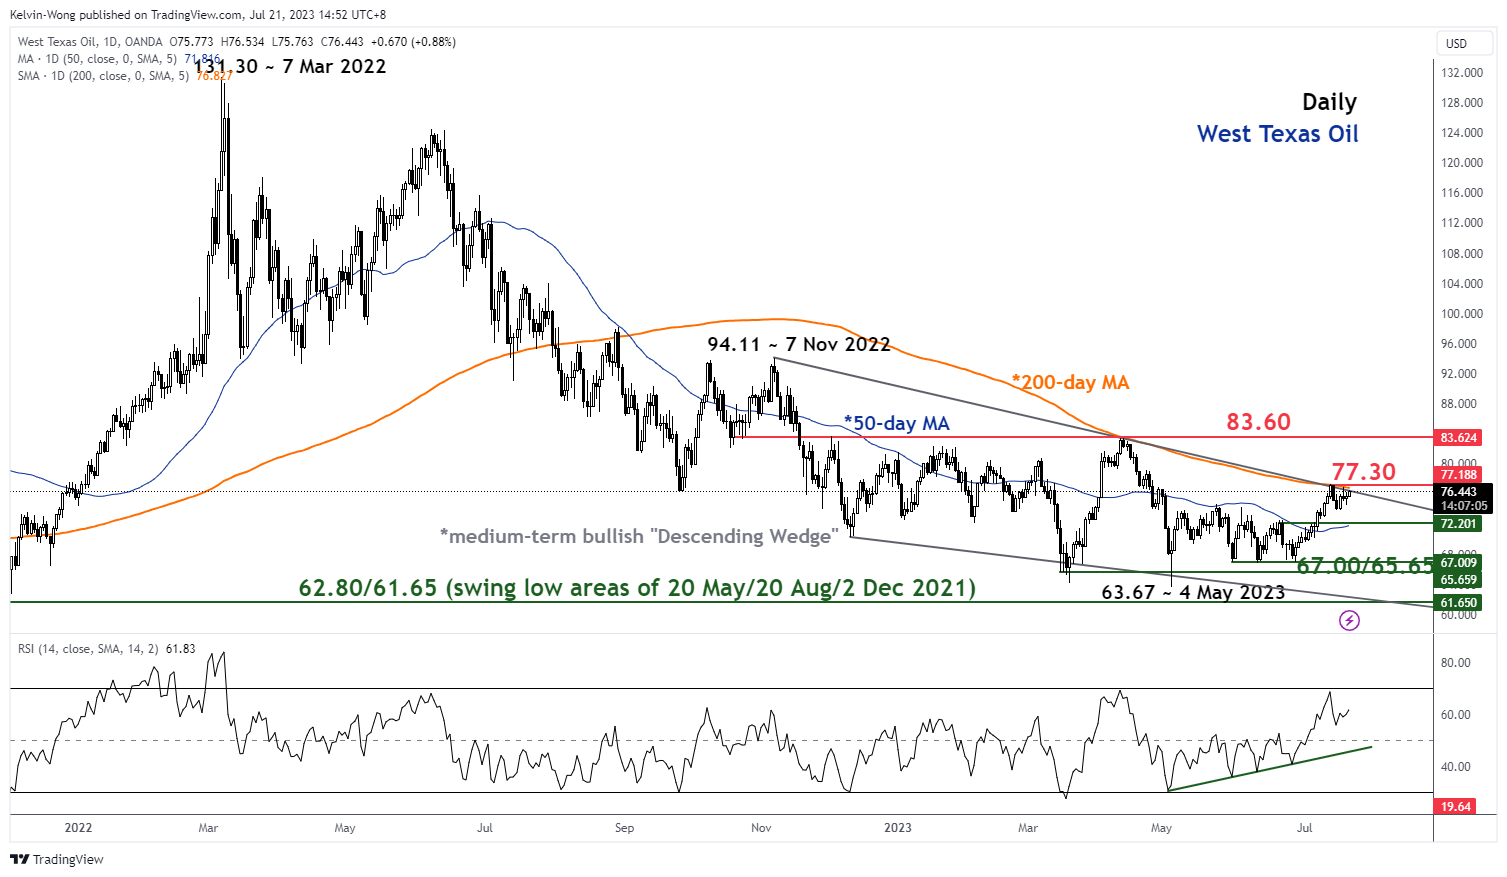
Fig 1: West Texas Oil major & medium-term trends as of 21 Jul 2023 (Source: TradingView, click to enlarge chart)
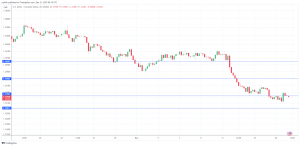
Oscillating within a short-term uptrend phase since 28 June 2023 low of US$66.95
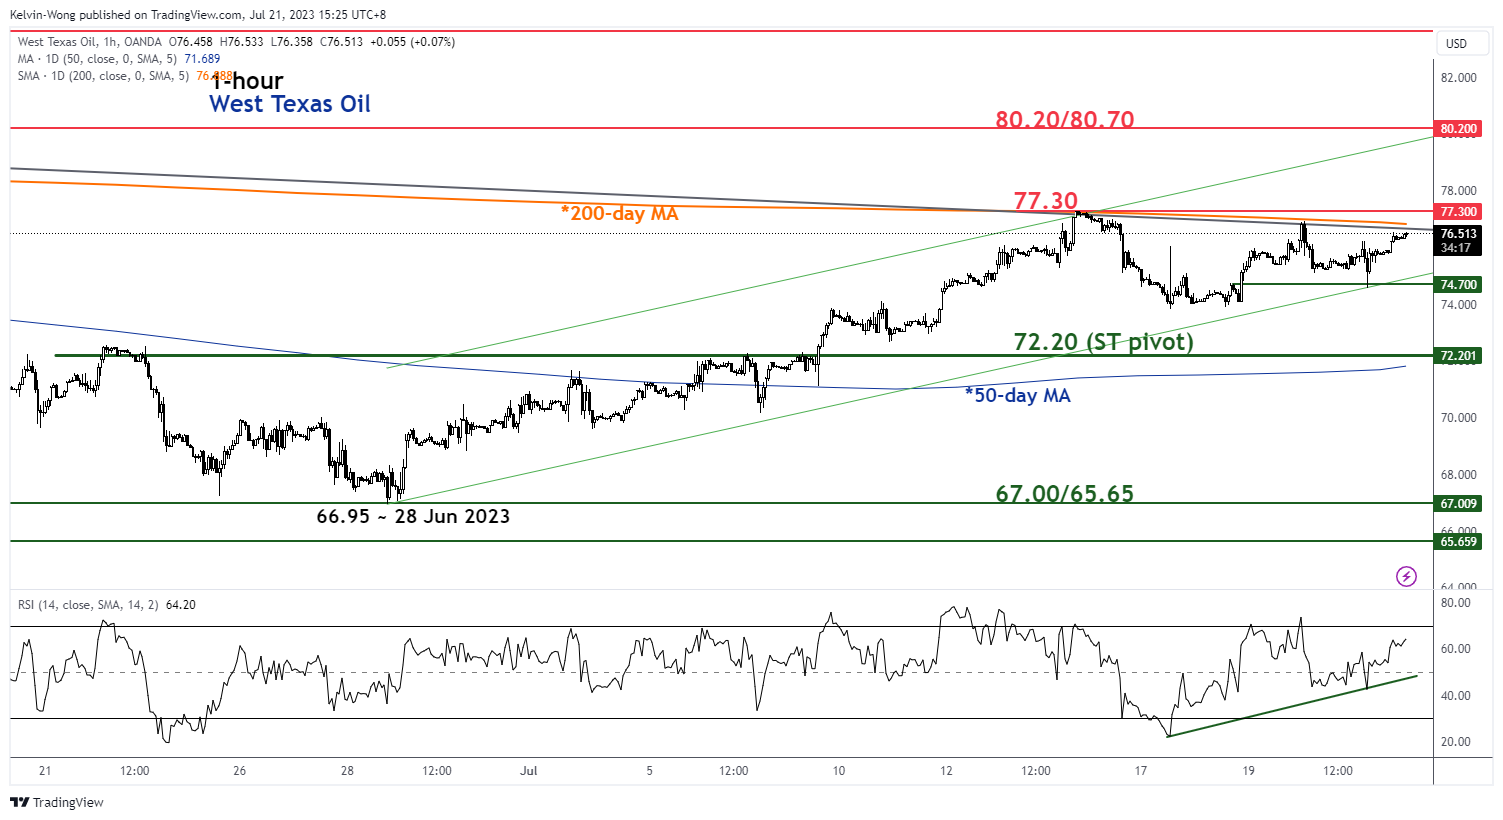
Fig 2: West Texas Oil minor short-term trend as of 21 Jul 2023 (Source: TradingView, click to enlarge chart)
Since its recent 28 June 2023 low of US$66.95, its price actions have started to evolve into a minor short-term uptrend phase and cleared above the 50-day moving average that is now turning upwards.
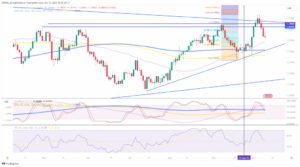
In addition, both the daily and hourly RSI oscillators are exhibiting positive configurations and readings which indicates that medium-term and short-term upside momentum remains intact.
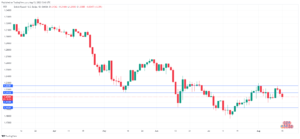
A clearance above US$77.30 key intermediate resistance (the 200-day moving average & the upper boundary of the medium-term “Descending Wedge”) may see a bullish breakout towards the next resistance at US$80.20/80.70 (the upper boundary of the minor ascending channel from 28 June 2023 low & a Fibonacci extension cluster) (see 1-hour chart).
However, failure to hold above US$72.20 key short-term pivotal support (also the 50-day moving average) negates the bullish tone to expose the key medium-term support at US$67.00/65.65.
Content is for general information purposes only. It is not investment advice or a solution to buy or sell securities. Opinions are the authors; not necessarily that of OANDA Business Information & Services, Inc. or any of its affiliates, subsidiaries, officers or directors. If you would like to reproduce or redistribute any of the content found on MarketPulse, an award winning forex, commodities and global indices analysis and news site service produced by OANDA Business Information & Services, Inc., please access the RSS feed or contact us at info@marketpulse.com. Visit https://www.marketpulse.com/ to find out more about the beat of the global markets. © 2023 OANDA Business Information & Services Inc.
Latest posts by Kelvin Wong (see all)
- SEO Powered Content & PR Distribution. Get Amplified Today.
- PlatoData.Network Vertical Generative Ai. Empower Yourself. Access Here.
- PlatoAiStream. Web3 Intelligence. Knowledge Amplified. Access Here.
- PlatoESG. Automotive / EVs, Carbon, CleanTech, Energy, Environment, Solar, Waste Management. Access Here.
- BlockOffsets. Modernizing Environmental Offset Ownership. Access Here.
- Source: https://www.marketpulse.com/oil/wti-oil-technical-potential-bullish-reversal-descending-wedge-in-play/kwong
- :has
- :is
- :not
- 1
- 11
- 15 years
- 15%
- 20
- 2020
- 2022
- 2023
- 28
- 30
- 65
- 67
- 7
- 70
- a
- About
- above
- access
- actions
- addition
- advice
- affiliates
- also
- an
- analysis
- and
- any
- ARE
- around
- AS
- At
- author
- authors
- avatar
- average
- award
- been
- below
- both
- Box
- breakout
- Bullish
- business
- buy
- by
- Channel
- Chart
- click
- Cluster
- COM
- combination
- Commodities
- conducted
- Configuration
- Connecting
- contact
- content
- courses
- crude
- Crude oil
- daily
- Directors
- Elliott
- enlarge
- Ether (ETH)
- evolve
- evolved
- exchange
- Exhibiting
- experience
- expert
- extension
- Failure
- Fibonacci
- financial
- Find
- flow
- For
- foreign
- foreign exchange
- forex
- found
- from
- fund
- fundamental
- Futures
- General
- Global
- global markets
- Have
- High
- hold
- HTTPS
- if
- in
- Inc.
- indicates
- Indices
- information
- Intermediate
- into
- investment
- IT
- ITS
- june
- Kelvin
- Key
- Last
- levels
- like
- loss
- Low
- Macro
- major
- March
- Market
- market outlook
- market research
- MarketPulse
- Markets
- max-width
- May..
- minor
- Momentum
- more
- moving
- moving average
- necessarily
- news
- next
- now
- numerous
- of
- officers
- Oil
- on
- only
- Opinions
- or
- out
- Outlook
- over
- passionate
- per
- perspectives
- phase
- photo
- pivotal
- plato
- Plato Data Intelligence
- PlatoData
- Play
- please
- positioning
- positive
- Posts
- potential
- price
- process
- Produced
- providing
- proxy
- purposes
- recent
- recorded
- remains
- research
- Resistance
- retail
- Reversal
- rsi
- rss
- Securities
- see
- sell
- senior
- service
- Services
- sharing
- short-term
- since
- Singapore
- site
- solution
- Source
- specializing
- started
- stock
- Stock markets
- Strategist
- Suggests
- support
- Swing
- Technical
- Technical Analysis
- ten
- texas
- that
- The
- thousands
- to
- TONE
- towards
- Traders
- Trading
- TradingView
- Training
- Trend
- Trends
- Turning
- unique
- Upside
- uptrend
- upwards
- us
- using
- v1
- Visit
- Wave
- WELL
- West
- which
- winning
- with
- within
- wong
- would
- WTI
- WTI Crude
- years
- you
- zephyrnet