- Earlier rally in WTI crude oil fizzled out ex-post OPEC+ meeting due to uncertainty over 2024 oil supply cut commitments from members.
- The strongest commitment came from Saudi Arabia where it will extend its its voluntary 1 million barrels per day supply through Q1 2024 while Angola has decided to go against its newly reduced supply target.
- Technical analysis suggests several positive elements in WTI crude oil despite the uncertainty over the demand and supply dynamics of the oil market.
- Watch the key support zone at US$74.30/72.40 per barrel for the week ahead.
This is a follow-up analysis of our prior report, “WTI Oil Technical: Recent plunge seems to have found a floor ahead of OPEC+” published on 22 November 2023. Click here for a recap.
In the recent two weeks, oil prices have exhibited wild swings of 6% to 8% as the bulls and the bears grappled with the uncertainty over oil supply cuts from OPEC+ coupled with increasing inventory stockpiles from the US and a sticky weak external demand environment.
The earlier OPEC+ ministerial meeting scheduled last Sunday has been rescheduled to yesterday, 30 November due to disagreements among African nations with leading member, Saudi Arabia on the quantum of the extended supply cuts for 2024.
In the lead-up to the outcome of yesterday’s meeting, oil prices staged an initial rally of close to 3% where the West Texas oil (a proxy of WTI crude oil futures) cleared above the 200-day moving average to print an intraday high of US$79.79/barrel due to several media reports that there was a possibility of deeper cuts enacted for 2024 before its gains were wiped out to close at a daily loss of -2.70% ex-post OPEC+ meeting.
The oil market has faced the curse of the “buy the rumour, sell the fact” due to uncertainty over the anticipated extended oil supply cuts for 2024. The strongest commitment came from Saudi Arabia where it would extend its voluntary 1 million barrels per day supply through Q1 2024 but there was an absence of a comprehensive breakdown of supply cuts among all members with only a selected few detailing their respective supply reductions.
Also, these agreed supply cuts for 2024 are voluntary which means members may defy the committed output quotas, and Angola has “revolted” against its new supply target and stated it will continue pumping as usual, increasing the risk of other OPEC+ members may not follow through on the latest set of agreed commitments.
In the lens of technical analysis, there are still several positive elements intact to potentially stall the ongoing bearish onslaught in oil prices.
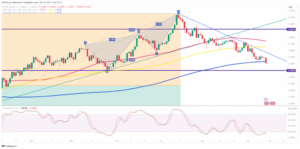
Weekly price actions have formed “long-legged Doji” candlesticks
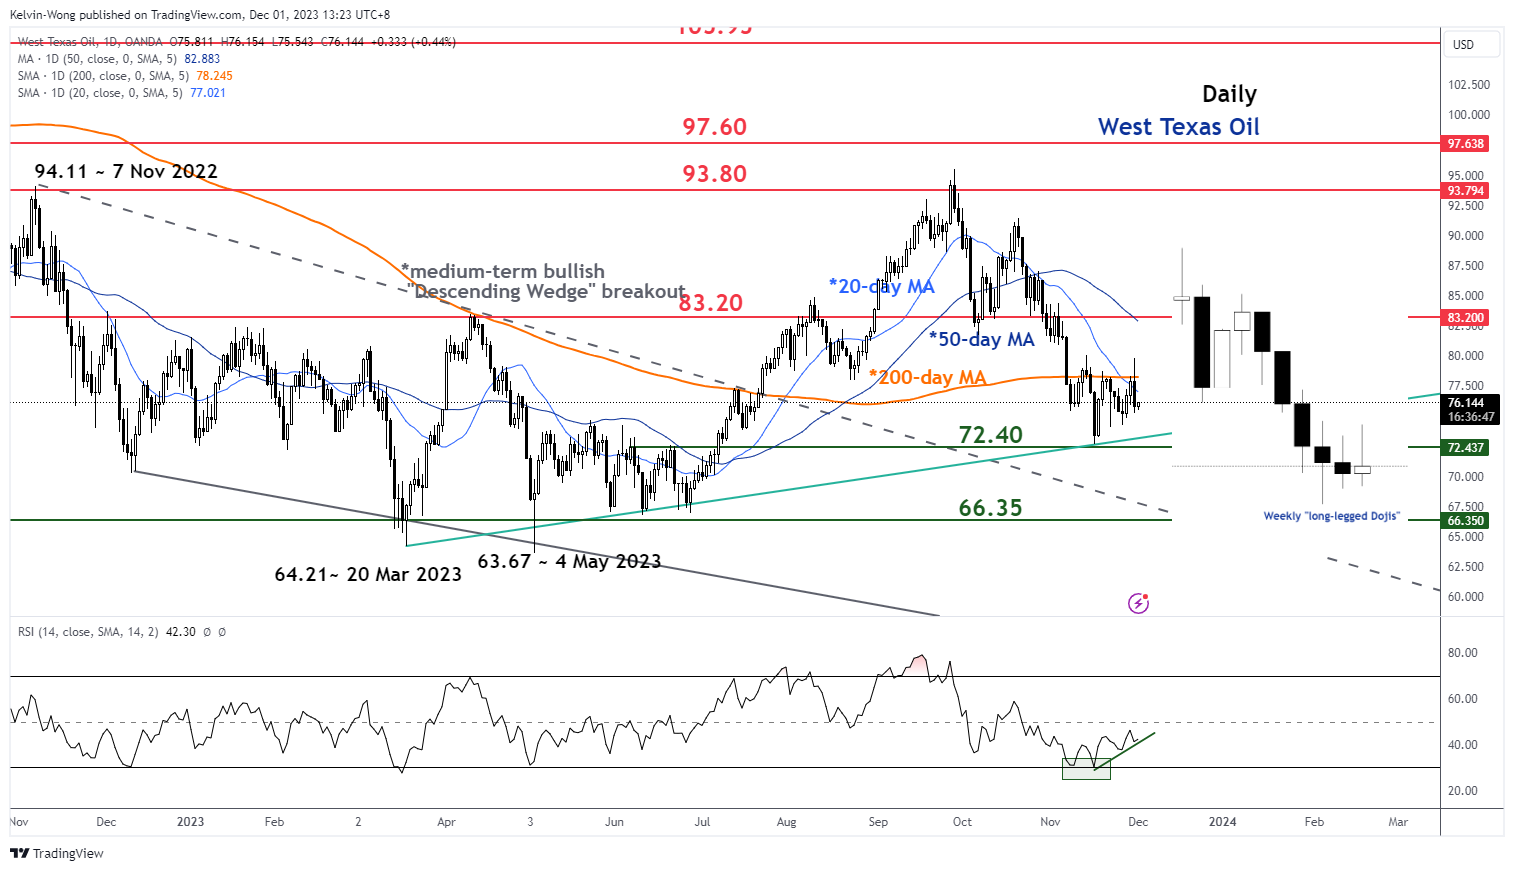
Fig 1: West Texas Oil medium-term trend as of 1 Dec 2023 (Source: TradingView, click to enlarge chart)
In the prior two weeks, the price actions of West Texas Oil have formed two weekly consecutive “long-legged Doji” candlestick patterns that suggest the current bearish sentiment has started to exhibit a form of “hesitation and indecisiveness” to potentially push prices lower.
In addition, the daily RSI momentum indicator has continued to inch higher since 16 November 2023 after it drifted down to its oversold zone.
These observations have taken shape right above a key medium-term support of US$72.40 (also the ascending trendline from the 20 March 2023 low) which suggests that the downside momentum of the two-month corrective decline of -23% from its 28 September 2023 high of US$95.50/barrel to 16 November 2023 low of US$72.68/barrel has started to abate.
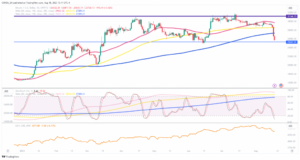
Impending minor bullish reversal “Inverse Head & Shoulders” sighted
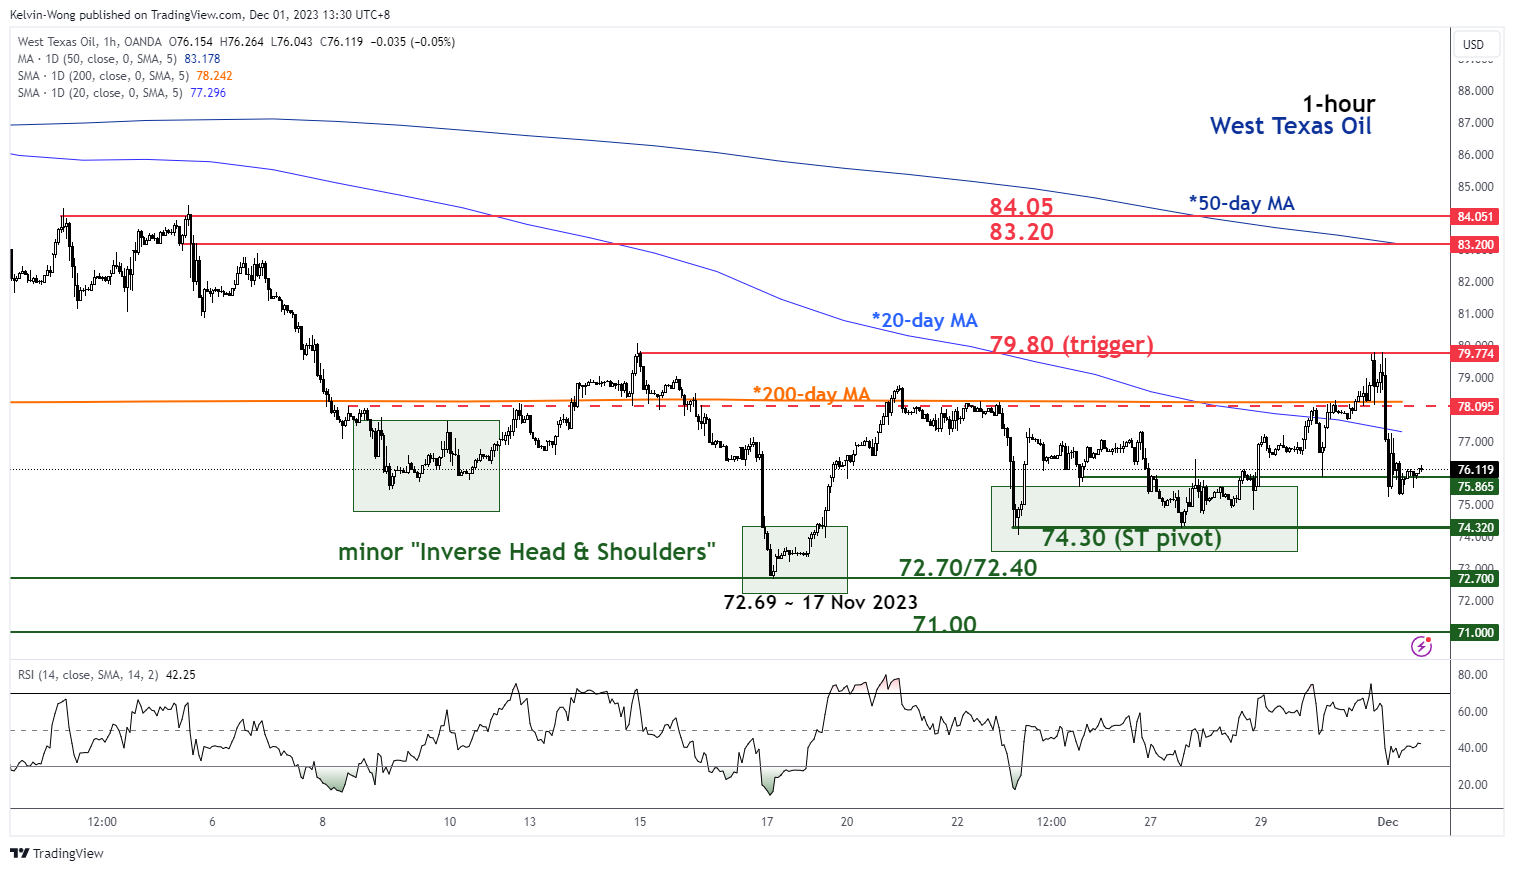
Fig 2: West Texas Oil minor short-term trend as of 1 Dec 2023 (Source: TradingView, click to enlarge chart)
On its shorter-term hourly chart, the price actions of West Texas Oil have traced out a potential minor “Inverse Head & Shoulders” bullish reversal configuration.
Watch the key short-term pivotal support at US$74.30 and a clearance above US$79.80 (neckline resistance of the “Inverse Head & Shoulders” may trigger a bullish breakout to see the next intermediate resistance coming at US$83.20/84.05 (also the downward sloping 50-day moving average).
However, failure to hold at US$74.30 exposes the medium-term support of US$72.70/72.40.
Content is for general information purposes only. It is not investment advice or a solution to buy or sell securities. Opinions are the authors; not necessarily that of OANDA Business Information & Services, Inc. or any of its affiliates, subsidiaries, officers or directors. If you would like to reproduce or redistribute any of the content found on MarketPulse, an award winning forex, commodities and global indices analysis and news site service produced by OANDA Business Information & Services, Inc., please access the RSS feed or contact us at info@marketpulse.com. Visit https://www.marketpulse.com/ to find out more about the beat of the global markets. © 2023 OANDA Business Information & Services Inc.
Latest posts by Kelvin Wong (see all)
- SEO Powered Content & PR Distribution. Get Amplified Today.
- PlatoData.Network Vertical Generative Ai. Empower Yourself. Access Here.
- PlatoAiStream. Web3 Intelligence. Knowledge Amplified. Access Here.
- PlatoESG. Carbon, CleanTech, Energy, Environment, Solar, Waste Management. Access Here.
- PlatoHealth. Biotech and Clinical Trials Intelligence. Access Here.
- Source: https://www.marketpulse.com/commodities/wti-oil-technical-positive-elements-intact-ex-post-opec/kwong
- :has
- :is
- :not
- :where
- 1
- 15 years
- 15%
- 16
- 20
- 2023
- 2024
- 22
- 28
- 30
- 40
- 700
- 80
- a
- About
- above
- access
- actions
- addition
- advice
- affiliates
- African
- After
- against
- agreed
- ahead
- All
- also
- among
- an
- analyses
- analysis
- and
- Anticipated
- any
- ARE
- around
- AS
- At
- author
- authors
- avatar
- average
- award
- barrels
- bearish
- Bears
- beat
- been
- before
- below
- Box
- Breakdown
- breakout
- Bullish
- Bulls
- business
- but
- buttons
- buy
- by
- came
- Chart
- clearance
- click
- Close
- COM
- combination
- coming
- commitment
- commitments
- committed
- Commodities
- comprehensive
- conducted
- Configuration
- Connecting
- consecutive
- contact
- content
- continue
- continued
- coupled
- courses
- crude
- Crude oil
- Current
- curse
- Cut
- cuts
- daily
- day
- decided
- Decline
- deeper
- defy
- Demand
- Despite
- Detailing
- Directors
- down
- downside
- downward
- due
- dynamics
- Earlier
- elements
- Elliott
- enlarge
- Environment
- Ether (ETH)
- exchange
- exhibit
- exhibited
- experience
- expert
- extend
- extended
- external
- faced
- Failure
- few
- financial
- Find
- Floor
- flow
- follow
- For
- foreign
- foreign exchange
- forex
- form
- formed
- found
- from
- fund
- fundamental
- Futures
- Gains
- General
- Global
- global markets
- Go
- Have
- head
- High
- higher
- hold
- HTTPS
- if
- in
- Inc.
- increasing
- Indicator
- Indices
- information
- initial
- Intermediate
- inventory
- investment
- IT
- ITS
- Kelvin
- Key
- Last
- latest
- leading
- Lens
- levels
- like
- loss
- Low
- lower
- Macro
- March
- Market
- market outlook
- market research
- MarketPulse
- Markets
- max-width
- May..
- means
- Media
- meeting
- member
- Members
- million
- minor
- Momentum
- more
- moving
- moving average
- Nations
- necessarily
- New
- newly
- news
- next
- November
- numerous
- observations
- of
- officers
- Oil
- on
- ongoing
- only
- onslaught
- Opinions
- or
- Other
- our
- out
- Outcome
- Outlook
- output
- over
- passionate
- patterns
- per
- perspectives
- photo
- pivotal
- plato
- Plato Data Intelligence
- PlatoData
- please
- plunge
- positioning
- positive
- possibility
- Posts
- potential
- potentially
- price
- Prices
- Prior
- Produced
- providing
- proxy
- pumping
- purposes
- Push
- Q1
- Quantum
- rally
- recap
- recent
- Reduced
- reductions
- report
- Reports
- research
- Resistance
- respective
- retail
- Reversal
- right
- Risk
- rsi
- rss
- Saudi
- Saudi Arabia
- scheduled
- Securities
- see
- seems
- selected
- sell
- senior
- sentiment
- September
- service
- Services
- set
- several
- Shape
- sharing
- short-term
- since
- Singapore
- site
- solution
- Source
- specializing
- started
- stated
- sticky
- Still
- stock
- Stock markets
- Strategist
- strongest
- subsidiaries
- suggest
- Suggests
- sunday
- supply
- support
- Swings
- taken
- Target
- Technical
- Technical Analysis
- ten
- texas
- that
- The
- their
- There.
- These
- thousands
- Through
- to
- Traders
- Trading
- TradingView
- Training
- Trend
- trigger
- two
- Uncertainty
- unique
- us
- using
- usual
- v1
- Visit
- voluntary
- was
- Wave
- week
- Week ahead
- weekly
- Weeks
- WELL
- were
- West
- which
- while
- Wild
- will
- winning
- with
- wong
- would
- WTI
- WTI Crude
- years
- yesterday
- you
- zephyrnet