Over the weekend, OPEC+
delivered some good news for the oil market, indicating
their intention to maintain prices above the $70 mark. Notably, Saudi Arabia
declared an additional voluntary production cut of 1 million barrels per day
(bpd) commencing in July, initially for one month, with the possibility of
extension based on market conditions. Furthermore, all other members of OPEC+
will prolong their production cuts throughout 2024.
While the OPEC+ supply cuts
may generate short-term bullish sentiment, it is important to recognize that
during a contractionary business cycle, the demand side heavily influences the
oil market. As evidenced by the recent surprising production cut, which was soon
after faded, oil prices experienced a sharp decline from the $83 peak to $64.
However, had it not been for the Sunday cut announcement, prices could have
dropped even further by now.
The economic data this week
has also weighed on the oil market as we got big misses in the US ISM Services PMI and the US Jobless Claims yesterday.
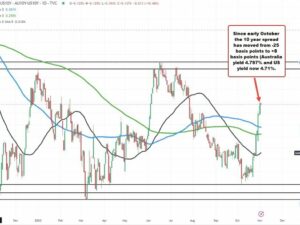
WTI Crude Oil Technical
Analysis – Daily Timeframe
WTI Crude Oil Daily
On the daily chart, we can see that oil just can’t
break above the $75 resistance as it
looks like we have found another range at a lower price level. That’s been the
case for quite some time now that the oil market gets stuck in ranges at lower
and lower levels as demand drops and OPEC+ cuts to avoid a bigger selloff in
prices. The support level at $64.30 will be key to watch as a break below that
should increase the selling momentum.
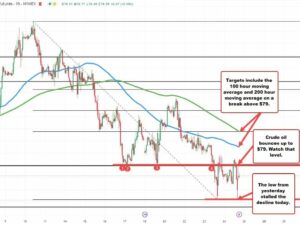
WTI Crude Oil Technical
Analysis – 4 hour Timeframe
WTI Crude Oil 4 hour
On the 4 hour chart, we can see that there isn’t
much to glean from this chart as the price action remains erratic beneath the
resistance zone. It’s just about waiting for a clear breakout or a fundamental
catalyst.
WTI Crude Oil Technical
Analysis – 1 hour Timeframe
WTI Crude Oil 1 hour
On the 1 hour chart, we can see that we
have a support zone at the $70 level. The buyers are likely to lean on this
zone to target the $75 level first and new highs afterwards. The sellers, on
the other hand, will want to see the price breaking lower to pile in and extend
the selloff towards the $64 support.
- SEO Powered Content & PR Distribution. Get Amplified Today.
- EVM Finance. Unified Interface for Decentralized Finance. Access Here.
- Quantum Media Group. IR/PR Amplified. Access Here.
- PlatoAiStream. Web3 Data Intelligence. Knowledge Amplified. Access Here.
- Source: https://www.forexlive.com/technical-analysis/wti-crude-oil-technical-analysis-20230609/
- :has
- :is
- :not
- 1
- 2024
- 30
- a
- About
- above
- Action
- Additional
- After
- afterwards
- All
- also
- an
- analysis
- and
- Announcement
- Another
- ARE
- AS
- At
- avoid
- barrels
- based
- BE
- been
- below
- Big
- bigger
- Break
- Breaking
- breakout
- Bullish
- business
- buyers
- by
- CAN
- case
- Catalyst
- Chart
- clear
- commencing
- conditions
- could
- crude
- Crude oil
- Cut
- cuts
- cycle
- daily
- data
- day
- Decline
- delivered
- Demand
- dropped
- Drops
- during
- Economic
- Even
- evidenced
- experienced
- extend
- extension
- First
- follow
- For
- found
- from
- fundamental
- further
- Furthermore
- generate
- had
- hand
- Have
- heavily
- Highs
- hour
- However
- HTTPS
- important
- in
- Increase
- indicating
- initially
- Intention
- IT
- jpg
- July
- just
- Key
- Level
- levels
- like
- likely
- LOOKS
- lower
- maintain
- mark
- Market
- market conditions
- May..
- Members
- million
- misses
- Momentum
- Month
- much
- New
- notably
- now
- of
- Oil
- on
- ONE
- or
- Other
- Peak
- plato
- Plato Data Intelligence
- PlatoData
- possibility
- price
- PRICE ACTION
- Prices
- Production
- range
- recent
- recognize
- remains
- Resistance
- Saudi
- Saudi Arabia
- see
- Sellers
- Selling
- SellOff
- sentiment
- Services
- sharp
- short-term
- should
- side
- some
- Soon
- supply
- support
- support level
- surprising
- Target
- Technical
- Technical Analysis
- that
- The
- their
- There.
- this
- this week
- throughout
- time
- to
- towards
- voluntary
- Waiting
- want
- was
- Watch
- we
- week
- weekend
- which
- will
- with
- WTI
- WTI Crude
- yesterday
- zephyrnet