Crude Oil eventually took off as the market started to have more tailwinds than headwinds as the supply and demand drivers aligned. In fact, on the supply side, the tensions in the Red Sea are still present and over the weekend three US troops got killed in Jordan by a drone attack linked to Iran-backed militants. Moreover, yesterday Saudi Arabia announced that it’s pausing plans to raise its crude production capacity.
On the demand side, the recent economic data has been showing a reacceleration in activity which is supported by the rate cuts expectations. On top of that, the PBoC last week decided to cut its Reserve Requirement Ratio by 50 bps and there are expectations for more easing measures to follow given the rout in the Chinese stock market.
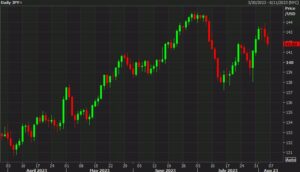
WTI Crude Oil Technical Analysis – Daily Timeframe
WTI Crude Oil Daily
On the daily chart, we can see that Crude Oil recently broke above the swing high around the $76 level and extended the rally into the $79 level before pulling back to retest the resistance now turned support. The buyers leant on the $76 level to position for another rally into the highs targeting a break above the $80 level. The sellers will likely step in around the highs to position for a drop into the major trendline around the $73 level and increase the bearish bets if the price were to break below the $76 support.
WTI Crude Oil Technical Analysis – 4 hour Timeframe
WTI Crude Oil 4 hour
On the 4 hour chart, we can see that the price recently pulled back and bounced from the support where we had also the trendline and the 61.8% Fibonacci retracement level for confluence. The buyers stepped in with a defined risk below the support to position for a rally into new highs. The sellers, on the other hand, will want to see the price breaking below the trendline and the support to pile in and target the major trendline around the $73 level.
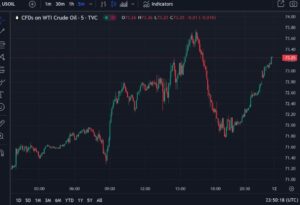
WTI Crude Oil Technical Analysis – 1 hour Timeframe
WTI Crude Oil 1 hour
On the 1 hour chart, we can see that the latest leg higher diverged with the MACD which is generally a sign of weakening momentum often followed by pullbacks or reversals. In this case, we got the pullback into the support zone where the price bounced from. The price then rallied and broke the most recent lower low turning the short-term trend back to bullish. We should now find buyers around the minor support zone at the $77.30 level where we have also the red 21 moving average for confluence. A break above the high at $78.15 should see even more bids coming into the market. The sellers, on the other hand, can only wait for the price to reach the $80 level or break below the support before getting back into the market.
Upcoming Events
Today we have the US Employment Cost Index and the ADP data before the FOMC rate decision later in the day. Tomorrow, we will see the latest US Jobless Claims figures and the ISM Manufacturing PMI. On Friday, we conclude the week with the US NFP report. Strong data should continue to support oil price while weak figures are likely to weigh on the market in the short term.
See the video below
- SEO Powered Content & PR Distribution. Get Amplified Today.
- PlatoData.Network Vertical Generative Ai. Empower Yourself. Access Here.
- PlatoAiStream. Web3 Intelligence. Knowledge Amplified. Access Here.
- PlatoESG. Carbon, CleanTech, Energy, Environment, Solar, Waste Management. Access Here.
- PlatoHealth. Biotech and Clinical Trials Intelligence. Access Here.
- Source: https://www.forexlive.com/technical-analysis/wti-crude-oil-technical-analysis-20240131/
- :has
- :is
- :where
- 1
- 15%
- 30
- 50
- a
- above
- activity
- adp
- aligned
- also
- analysis
- and
- announced
- Another
- ARE
- around
- AS
- At
- attack
- back
- bearish
- been
- before
- below
- Bets
- Break
- Breaking
- Broke
- Bullish
- buyers
- by
- CAN
- Capacity
- case
- Chart
- chinese
- claims
- coming
- conclude
- confluence
- continue
- Cost
- crude
- Crude oil
- Cut
- cuts
- daily
- data
- day
- decided
- decision
- defined
- Demand
- drivers
- drone
- Drop
- easing
- Economic
- employment
- Even
- eventually
- expectations
- extended
- fact
- Figures
- Find
- follow
- followed
- FOMC
- FOMC rate decision
- For
- Friday
- from
- generally
- getting
- given
- got
- had
- hand
- Have
- headwinds
- High
- higher
- Highs
- hour
- HTTPS
- if
- in
- Increase
- index
- into
- ITS
- jobless claims
- Jordan
- jpg
- Last
- later
- latest
- Level
- likely
- linked
- Low
- lower
- major
- manufacturing
- Market
- measures
- minor
- Momentum
- more
- Moreover
- most
- New
- nfp
- now
- of
- off
- often
- Oil
- oil price
- on
- only
- or
- Other
- over
- pausing
- PBOC
- plans
- plato
- Plato Data Intelligence
- PlatoData
- pmi
- position
- present
- price
- Production
- pullback
- pulling
- raise
- rally
- Rate
- ratio
- reach
- recent
- recently
- Red
- report
- requirement
- Reserve
- Risk
- Rout
- Saudi
- Saudi Arabia
- SEA
- see
- Sellers
- Short
- short-term
- should
- showing
- side
- sign
- started
- Step
- Still
- stock
- stock market
- strong
- supply
- support
- Supported
- Swing
- Target
- targeting
- Technical
- Technical Analysis
- tensions
- term
- than
- that
- The
- then
- There.
- this
- three
- to
- tomorrow
- took
- top
- Trend
- Turned
- Turning
- us
- US Jobless Claims
- us NFP
- Video
- wait
- want
- we
- week
- weekend
- weigh
- were
- which
- while
- will
- with
- WTI
- WTI Crude
- yesterday
- zephyrnet
- zone