
The talented data analysts at Rhodium Corp. reported this week that U.S. emissions of greenhouse gases fell nearly two percent last year, even as national economic output rose by 2.4%. This was good news, further evidence of “decoupling” emissions from economic activity, but also bad news, because, says Rhodium, the 1.9% drop in GHG’s was woefully short of the 6.9% annual decrease required from now to 2030 to meet our Paris target of a 50-52% reduction in GHG emissions below 2005 levels.
 Here we examine the locus of the good news: the 8% drop in electricity generation in 2023 vs. 2022 that enabled the 2% drop in overall emissions despite rises in emissions from transportation and some other sectors.
The chart at left seems to reinforce the customary line that the leading driver of reduced U.S. carbon emissions is the switch to gas-fired power generation from coal-fired electricity. Indeed, the 101 TWh increase in gas-fired kilowatt-hours accounted numerically for three-quarters of the 134 TWh drop in coal, showing the close (if inverse) link between the two. Since modern “combined cycle” gas-burning plants emit a whopping 60% less CO2 per kWh than coal-burners, substituting the one for the other is a climate win, even allowing for the greenhouse impacts of methane released in gas drilling and transmission.
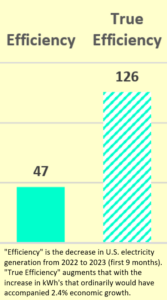
What’s missing from this narrative is the role of energy efficiency in suppressing demand for electricity, depicted in the graph’s two right-most bars.
The first bar, showing a gain of 47 TWh labeled as Efficiency, denotes the reduction in total U.S. electricity generation over the first 9 months of 2023 vs. the year-earlier 9-month total. If not for that contraction, either the reduction in coal-fired electricity would have been smaller than the 134 TWh shown, or the increase in gas-fired electricity would have had to be greater than the actual 101 TWh, or a combination of the two. (The other sources — nuclear, hydro, wind and solar — are already producing at their maximum capability.) Power-sector emissions would have been greater in either case.
 But the efficiency story doesn’t end there. U.S. economic output wasn’t flat in 2023, it grew by 2.4% over 2022 (per preliminary figures reported by Rhodium). In earlier periods of U.S. history, that economic growth would have required greater electricity production. For most of the last century, the ratio averaged around 2-to-1, i.e., electricity growth was twice as fast as overall GDP growth. From 1975 to around 2005, the relationship was around 1-to-1. Since 2005, in a profound development that few predicted (and which few have acknowledged, other than CTC), U.S. electricity usage has been virtually flat, even as economic activity has risen by more than 40 percent.
For this post, and in the chart above, I’ve used a 1-to-1 relationship, i.e., I’ve assumed that if not for increased energy efficiency, the 2.4% year-on-year growth in U.S. economic activity would have required a corresponding 2.4% increase in electricity production. Numerically, nearly 80 additional TWh would have been required (calculated as 2.4% of 2022 9-month U.S. electricity production, including rooftop solar, of 3,283,000 TWh). Adding that to the actual decrease in electricity yields the true efficiency figure of 126 TWh shown in the right-most bar.
The biggest enabler of the 2022 drop in coal-fired electricity generation, then, wasn’t increased power production from natural gas, which grew by 101 TWh. It certainly wasn’t solar, which grew by a lot percentage-wise, nearly 15%, but by just 27 TWh in absolute terms. Nor was it the U.S. wind sector, which actually contracted in the first nine months of the year (see first chart, above).
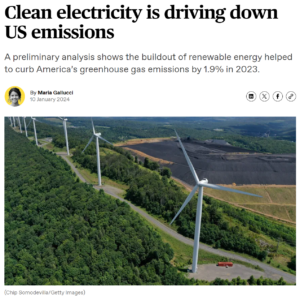
Well-meaning misinformation from Canary Media, Jan. 10. See link to story in text.
Others are spinning the 2023 data differently. Rhodium reports that “coal is playing less and less of a role on the grid, while both natural gas and renewable generators are filling the gap.” True, but it leaves out the vital — I would say central — role played by energy efficiency in constraining U.S. electricity demand so that the increase in gas-burning could be held to 101 TWh.
For sheer distortion it’s hard to top Canary Media’s take, shown at left. While it’s true that “the buildout of renewable energy helped to curb America’s greenhouse gas emissions by 1.9% in 2023,” the actual gain in renewable power output was a sideshow to electricity efficiency. Indeed, netting the 27 TWh increase in solar output by the combined 23 TWh decrease in hydro and wind generation combined leaves almost nothing in the way of net renewables growth.
This suggests updating the adage about victory having a thousand fathers while defeat is an orphan. In climate circles and energy policy, last year’s modest success in reducing emissions has multiple parents: more gas-burning, more solar arrays, more renewables. Meanwhile, the truest parent — increased efficiency in electricity usage — goes unremarked. This inattention is mirrored in policy. The Inflation Reduction Act subsidizes everything from electric cars and heat pumps to battery storage and factories to supply wind turbines and solar cells. It doesn’t, for the most part, subsidize ways to use energy more efficiently.
That’s not deliberate, it’s the nature of energy efficiency, savings and conservation: they involve ways of doing more with less, and they come in a million guises. They can’t be subsidized, but they can be rewarded, by taxing carbon emissions.
We’ve been saying for two decades: Taxes on fossil fuels, levied “upstream” at mines, wells and import docks, raise the value of every personal, corporate and collective action to reduce unnecessary use of energy. There’s no way around taxing carbon.
- SEO Powered Content & PR Distribution. Get Amplified Today.
- PlatoData.Network Vertical Generative Ai. Empower Yourself. Access Here.
- PlatoAiStream. Web3 Intelligence. Knowledge Amplified. Access Here.
- PlatoESG. Carbon, CleanTech, Energy, Environment, Solar, Waste Management. Access Here.
- PlatoHealth. Biotech and Clinical Trials Intelligence. Access Here.
- Source: https://www.carbontax.org/blog/2024/01/11/whats-really-driving-u-s-co2-reductions/
- :has
- :is
- :not
- 000
- 1
- 10
- 15%
- 2%
- 2005
- 2022
- 2023
- 2030
- 23
- 27
- 33
- 362
- 40
- 80
- 9
- a
- About
- above
- Absolute
- accounted
- acknowledged
- Act
- Action
- activity
- actual
- actually
- adding
- Additional
- Allowing
- almost
- already
- also
- an
- Analysts
- and
- annual
- ARE
- around
- AS
- assumed
- At
- Bad
- bar
- bars
- battery
- battery storage
- BE
- because
- been
- below
- between
- Biggest
- both
- but
- by
- calculated
- CAN
- capability
- carbon
- carbon emissions
- cars
- case
- Cells
- central
- Century
- certainly
- Chart
- circles
- Climate
- Close
- co2
- Coal
- Collective
- Collective Action
- combination
- combined
- come
- CONSERVATION
- contraction
- Corp
- Corporate
- Corresponding
- could
- data
- dc
- decades
- decrease
- Demand
- denotes
- description
- Despite
- Development
- differently
- Doesn’t
- doing
- drilling
- driver
- driving
- Drop
- e
- Earlier
- Economic
- Economic growth
- efficiency
- efficiently
- either
- Electric
- electric cars
- electricity
- electricity usage
- Emissions
- enabled
- enabler
- end
- energy
- energy efficiency
- Even
- Every
- everything
- evidence
- examine
- factories
- FAST
- few
- Figure
- Figures
- filling
- First
- flat
- For
- fossil
- fossil fuels
- from
- fuels
- further
- Gain
- gap
- GAS
- GDP
- gdp growth
- generation
- generators
- GHG
- GHG emissions
- Goes
- good
- greater
- greenhouse gas
- Greenhouse gas emissions
- grew
- Grid
- Growth
- had
- Hard
- Have
- having
- Held
- helped
- history
- http
- HTTPS
- i
- if
- Impacts
- import
- in
- Including
- Increase
- increased
- inflation
- involve
- IT
- Jan
- just
- Last
- Last Year
- leading
- left
- less
- levels
- Line
- LINK
- Lot
- max-width
- maximum
- Meanwhile
- Media
- Meet
- methane
- million
- mines
- Misinformation
- missing
- Modern
- modest
- months
- more
- most
- multiple
- NARRATIVE
- National
- Natural
- Natural Gas
- Nature
- nearly
- net
- netting
- news
- nine
- no
- nor
- nothing
- now
- nuclear
- of
- on
- ONE
- or
- Other
- our
- out
- output
- over
- overall
- parents
- paris
- part
- per
- percent
- periods
- personal
- plants
- plato
- Plato Data Intelligence
- PlatoData
- played
- playing
- policy
- Post
- power
- predicted
- preliminary
- producing
- Production
- profound
- pumps
- raise
- ratio
- really
- reduce
- Reduced
- reducing
- reducing emissions
- reduction
- reductions
- reinforce
- relationship
- released
- Renewable
- renewable energy
- Renewables
- Reports
- required
- rewarded
- Rhodium
- Risen
- Rises
- Role
- ROSE
- s
- Savings
- say
- saying
- says
- sector
- Sectors
- see
- seems
- Share
- Short
- showing
- shown
- since
- smaller
- So
- solar
- Solar cells
- some
- Sources
- storage
- Story
- success
- Suggests
- supply
- suppressing
- Switch
- talented
- Target
- terms
- text
- than
- that
- The
- their
- then
- There.
- they
- this
- thousand
- to
- top
- Total
- transportation
- true
- Twice
- two
- u.s.
- updating
- Usage
- use
- used
- value
- victory
- virtually
- vital
- vs
- W3
- was
- Way..
- ways
- we
- Wells
- which
- while
- win
- wind
- with
- woefully
- would
- year
- yields
- zephyrnet
![If the world wants to limit warming, it will have to limit demand for oil and gas because [the oil] industry can deliver this kind of volume for many more decades.”](https://platoaistream.com/wp-content/uploads/2023/04/if-the-world-wants-to-limit-warming-it-will-have-to-limit-demand-for-oil-and-gas-because-the-oil-industry-can-deliver-this-kind-of-volume-for-many-more-decades.png)


![[I]f big change is hard, bigger change is even harder. How are we going to build a whole new economic system [to replace capitalism] if we can’t even enact a carbon tax?”](https://platoaistream.com/wp-content/uploads/2022/12/if-big-change-is-hard-bigger-change-is-even-harder-how-are-we-going-to-build-a-whole-new-economic-system-to-replace-capitalism-if-we-cant-even-enact-a-carbon-tax.png)

