TL;DR Breakdown
- The latest VeChain price analysis shows bearish signs.
- Price has decreased till $0.11 today.
- Support is found at the $0.109 level.
The VeChain price analysis is indicating that the price levels have dropped down to $0.11 once again. The bearish slop has been continuous during the day, and it is further strengthened by today’s loss. More sellers are attracted to selling their assets, which is why VET price levels are going down. The short-term trending line is thus moving downwards, which is a major bearish indication as well.
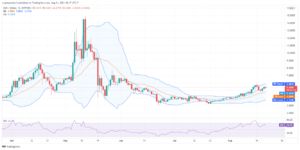
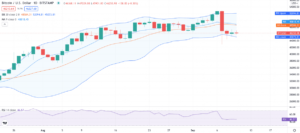
VET/USD 1-day price chart: Price deviates once again as bears strike
The 1-day VeChain price analysis is going strong for the Bears, as price levels are downgrading again after a brief bullish interval. The price has decreased up to $0.11, and it seems that the bears are trying to regain their lost momentum.
The past week has been greatly supportive towards the bears, and the trend is following up for today as well. Other values include the moving average (MA) value which is currently settled at the $0.125 spot.

The volatility is slowly increasing which could be taken as a negative hint for the future. The Bollinger band values in the above price chart are as follows; the upper Bollinger band is present at $0.153 while the lower Bollinger band is at $0.102. Whereas the Relative Strength Index (RSI) score is also going down again, and this time it has gone back to 43.53 level.
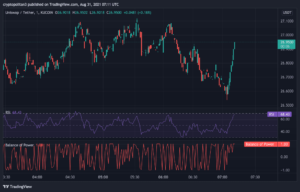
VeChain price analysis: Price levels stumble below $0.11 after bearish push
The 4-hours VeChain price analysis is showing that the price has undergone a significant loss after bearish activity. The bears have been at lead for the past few hours, and they are still maintaining their high position as the price has decreased further.
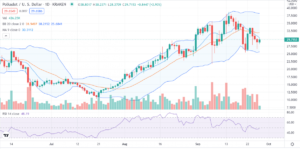
The moving average value is above the current price i.e. at $0.12 because of the recent bearish drive. Meanwhile, the Bollinger bands are securing an average of $0.116 in the 4-hours price chart.

The upper Bollinger band is standing at the $0.123 level whereas the lower Bollinger band is now present at the $0.109 level. If we talk about the RSI score in the following chart, then it has also stooped down to 38 because of the bearish trend.

As the VET price has downgraded further after continuous bearish strikes, the technical indicators chart is giving the selling signal. There are 12 indicators resting at the selling position, 10 indicators at the neutral position while four indicators are resting at the buying position.
The moving averages indicators are also going bearish as there has been a significant drop in the price. There are 10 indicators settled at the selling spot, four at the buying spot and only one indicator is there at the neutral spot.
Similar hints are being given by the Oscillators as it is giving a positive signal to the sellers. There are a total of nine oscillators fixed at the neutral position, two at the selling position while the buying position holds no oscillator.
VeChain price analysis conclusion
The given 1-day and 4-hours VeChain price analysis is confirming the downtrend for the day, as the bears are at the leading game right now. The bearish momentum has taken the price levels down to $0.11, which is a significant decline in the price.
There is an avid chance that the price will go even further than the support level at $0.109 to maintain a new low. This prediction can be confirmed in the upcoming days according to the trends that would be observed.
Disclaimer. The information provided is not trading advice. Cryptopolitan.com holds no liability for any investments made based on the information provided on this page. We strongly recommend independent research and/or consultation with a qualified professional before making any investment decisions.
Source: https://api.follow.it/track-rss-story-click/v3/tHfgumto13D6whtGBSKhgkGT5aWO9DEx
- 11
- 116
- advice
- analysis
- Assets
- bearish
- Bearish Momentum
- Bears
- Bullish
- Buying
- Current
- data
- day
- Drop
- dropped
- future
- game
- Giving
- High
- HTTPS
- index
- information
- investment
- Investments
- IT
- latest
- lead
- leading
- Level
- liability
- Line
- major
- Making
- Momentum
- Other
- prediction
- present
- price
- Price Analysis
- research
- Sellers
- Signs
- Spot
- Strikes
- support
- support level
- Technical
- Tide
- time
- Trading
- trending
- Trends
- value
- VeChain
- Volatility
- week