
USD
- The Fed left interest rates unchanged as
expected at the last meeting with basically no change to the statement. - Fed Chair Powell stressed
once again that they are proceeding carefully as the full effects of policy
tightening have yet to be felt. - The US Core PCE last
week came in line with forecasts with the disinflationary progress continuing
steady. - The labour market continues to show weakness as Continuing
Claims are now rising at a fast pace with the last NFP report
missing across the board. This week’s Job Openings and ADP came
below forecasts. although the Jobless Claims were
better than expected. - The ISM Manufacturing
PMI
last week missed expectations falling further into contraction, while the ISM Services PMI beat
forecasts holding on in expansion. - The hawkish Fed members recently shifted
their stance to a more neutral position. - The market expects the Fed to start cutting rates
as soon as Q1 2024.
CAD
- The BoC kept the interest rate steady at
5.00% as expected with the usual caveat that
it’s prepared to raise the policy rate further if needed. - BoC Governor Macklem recently has been leaning on a more
neutral side as inflation continues to abate. - The recent Canadian CPI missed expectations across the
board and the underlying inflation measures eased, which was a welcome
development for the BoC. - On the labour market side, the latest report beat expectations
although the unemployment rate ticked higher again. - The market expects the BoC to start
cutting rates in Q2 2024.
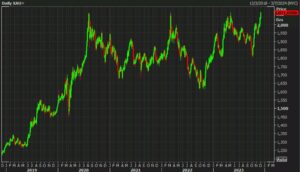
USDCAD Technical Analysis –
Daily Timeframe
USDCAD Daily
On the daily chart, we can see that USDCAD pulled
back into the downward trendline where we
have also the confluence with the
50% Fibonacci retracement level
and the red 21 moving average. This is
where the sellers are likely to pile in with a defined risk above the trendline
to position for another drop into the swing low at 1.3382. The buyers, on the
other hand, will want to see the price breaking higher to invalidate the
bearish setup and position for a rally into the highs.
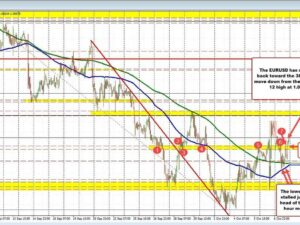
USDCAD Technical
Analysis – 4 hour Timeframe
USDCAD 4 hour
On the 4
hour chart, we can see more closely the bearish setup around the trendline
where there’s also the resistance defined
by the previous major swing low and the round psychological 1.36
handle. What happens around this resistance zone will likely decide where the
pair will head next as a strong rejection should lead to new lows while a break
to the upside is likely to trigger a rally into the previous highs.
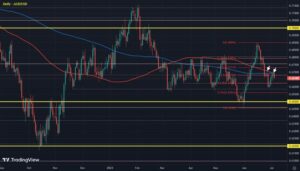
USDCAD Technical Analysis –
1 hour Timeframe
USDCAD 1 hour
On the 1 hour chart, we can see that the latest
leg higher diverged with
the MACD which
is generally a sign of weakening momentum often followed by pullbacks or
reversals. In this case, it might be another bearish confluence for the sellers
as it’s happening right at the key resistance zone. The sellers already piled
in at the resistance with a defined risk above it and if the price was to
revisit that level, we can expect even more sellers stepping in. If the price
falls and breaks the recent higher low at 1.3550 though, the sellers are likely
to increase their bearish bets as the market structure on this timeframe will
switch to a downtrend again.
Upcoming Events
Today all eyes will be on the US NFP report as it
could increase the amount of rate cuts expected in 2024 or reverse some of them.
See the video below
- SEO Powered Content & PR Distribution. Get Amplified Today.
- PlatoData.Network Vertical Generative Ai. Empower Yourself. Access Here.
- PlatoAiStream. Web3 Intelligence. Knowledge Amplified. Access Here.
- PlatoESG. Carbon, CleanTech, Energy, Environment, Solar, Waste Management. Access Here.
- PlatoHealth. Biotech and Clinical Trials Intelligence. Access Here.
- Source: https://www.forexlive.com/technical-analysis/usdcad-technical-analysis-watch-what-happens-around-this-key-resistance-zone-20231208/
- :has
- :is
- :where
- 1
- 2024
- 36
- a
- above
- across
- again
- All
- already
- also
- Although
- amount
- analysis
- and
- Another
- ARE
- around
- AS
- At
- back
- Basically
- BE
- bearish
- beat
- been
- below
- Bets
- Better
- board
- BoC
- Break
- Breaking
- breaks
- buyers
- by
- came
- CAN
- carefully
- case
- Chair
- change
- Chart
- claims
- closely
- confluence
- continues
- continuing
- contraction
- Core
- could
- cuts
- cutting
- daily
- decide
- defined
- Development
- downward
- Drop
- effects
- Even
- expansion
- expect
- expectations
- expected
- expects
- Eyes
- Falling
- Falls
- FAST
- Fed
- felt
- followed
- For
- forecasts
- full
- further
- generally
- hand
- handle
- Happening
- happens
- Have
- Hawkish
- head
- higher
- Highs
- holding
- hour
- HTTPS
- if
- in
- Increase
- inflation
- interest
- INTEREST RATE
- Interest Rates
- into
- IT
- jpg
- Key
- key resistance
- Labour
- Last
- latest
- lead
- Level
- likely
- Line
- Low
- Lows
- major
- manufacturing
- Market
- Market Structure
- measures
- meeting
- Members
- might
- missed
- missing
- Momentum
- more
- needed
- Neutral
- New
- next
- nfp
- no
- now
- of
- often
- on
- once
- or
- Other
- Pace
- pair
- plato
- Plato Data Intelligence
- PlatoData
- policy
- position
- prepared
- previous
- price
- Progress
- Q1
- Q2
- raise
- rally
- Rate
- Rates
- recent
- recently
- Red
- report
- Resistance
- reverse
- right
- rising
- Risk
- see
- Sellers
- Services
- setup
- shifted
- should
- show
- side
- sign
- some
- Soon
- stance
- start
- Statement
- steady
- stepping
- strong
- structure
- Swing
- Switch
- Technical
- Technical Analysis
- than
- that
- The
- the Fed
- their
- Them
- they
- this
- though?
- tightening
- timeframe
- to
- trigger
- underlying
- unemployment
- unemployment rate
- Upside
- us
- us NFP
- usual
- Video
- want
- was
- Watch
- we
- weakness
- week
- welcome
- were
- What
- which
- while
- will
- with
- yet
- zephyrnet