- USD/MXN climbs back above 17.80 at the beginning of the week.
- Inflation data this week to shed light on Fed’s June meeting.
- Mexican inflation figures to give USD/MXN traders clues for Banxico’s monetary policy meeting on May 18.
The USD/MXN makes a U-turn and climbs back above the 17.80 figure at the beginning of the week, as US Treasury bond yields edge up, while a risk-off impulse keeps Wall Street in the red. Solid data from the United States (US) cushioned the last week’s USD/MXN fall. At the same time, speculations that the Mexican central bank will pause its tightening cycle could trigger outflows from the emerging market currency. At the time of writing, the USD/MXN is trading at 17.8354.
US Dollar recovery, on speculations of Mexican central bank pausing tightening cycle
The US Dollar (USD) has shown signs of recovery against the Mexican Peso (MXN). Last Friday, the latest US jobs report showed signs of tightness, which warrants further action by the US Federal Reserve (Fed). Even though the Fed opened the door for a pause on its tightening cycle, this week’s inflation data could shed some light on what the Fed can do in June’s meeting.
Meanwhile, discussions about the US debt ceiling shifted sentiment sour. According to Janet Yellen, the US Treasury Secretary, there are no favorable alternatives to resolve the debt limit issue in Washington without assistance from the US Congress.
The US economic docket revealed data from the US Department of Commerce. Wholesale Inventories for March came at 0% MoM, below estimates of 0.1% expansion, though annually-based figures showed an improvement.
On the Mexican front, the agenda is empty for Monday. Still, on Tuesday, inflation figures would give USD/MXN traders some clues regarding the Bank of Mexico’s (Banxico) path toward its May 18 monetary policy meeting.
USD/MXN Technical Analysis

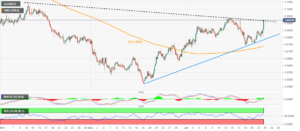
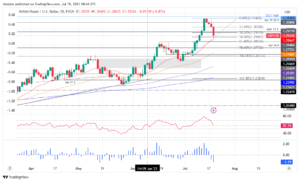
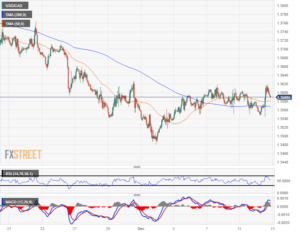
Once the USD/MXN found its floor around 17.7405, hitting six-year lows, the USD/MXN jumped off the year-to-date (YTD) low toward the 17.80 area. Even though the USD/MXN is still downward biased, a divergence between the Relative Strength Index (RSI) indicator printing higher troughs while the USD/MXN pair registers lower lows suggests that selling pressure is fading. If USD/MXN climbs above 18.0000, that will expose the 50-day EMA at 18.2087. A breach of the latter and above the April 26 high would open the door to test April’s high of 18.4008, followed by the 100-day EMA at 18.5371.
- SEO Powered Content & PR Distribution. Get Amplified Today.
- PlatoAiStream. Web3 Data Intelligence. Knowledge Amplified. Access Here.
- Minting the Future w Adryenn Ashley. Access Here.
- Buy and Sell Shares in PRE-IPO Companies with PREIPO®. Access Here.
- Source: https://www.fxstreet.com/news/usd-mxn-makes-a-comeback-as-us-dollar-recovers-vs-the-mexican-peso-202305081617
- :has
- :is
- $UP
- 26
- a
- About
- above
- According
- Action
- against
- agenda
- alternatives
- an
- and
- April
- ARE
- AREA
- around
- AS
- Assistance
- At
- back
- Bank
- Beginning
- below
- between
- biased
- bond
- Bond yields
- breach
- by
- came
- CAN
- ceiling
- central
- Central Bank
- Chart
- Comeback
- Commerce
- Congress
- could
- Currency
- cushioned
- cycle
- daily
- data
- Debt
- Department
- discussions
- Divergence
- do
- Dollar
- Door
- downward
- Economic
- Edge
- EMA
- emerging
- emerging market
- estimates
- Even
- expansion
- Fall
- Fed
- Federal
- federal reserve
- Figure
- Figures
- Floor
- followed
- For
- found
- Friday
- from
- front
- further
- Give
- High
- higher
- hitting
- HTTPS
- if
- improvement
- in
- index
- Indicator
- inflation
- inflation figures
- issue
- ITS
- Jobs
- jobs report
- june
- Last
- latest
- light
- LIMIT
- Low
- Lows
- MAKES
- March
- Market
- May..
- meeting
- mom
- Monday
- Monetary
- Monetary Policy
- no
- of
- off
- on
- open
- opened
- outflows
- path
- Peso
- plato
- Plato Data Intelligence
- PlatoData
- policy
- pressure
- printing
- Recovers
- recovery
- Red
- regarding
- registers
- relative strength index
- Relative Strength Index (RSI)
- report
- Reserve
- Revealed
- rsi
- same
- secretary
- Selling
- sentiment
- shed
- shifted
- shown
- Signs
- solid
- some
- States
- Still
- street
- strength
- Suggests
- Technical
- test
- that
- The
- the Fed
- The US Federal Reserve
- There.
- this
- this week
- though?
- tightening
- time
- to
- toward
- Traders
- Trading
- treasury
- treasury secretary
- trigger
- Tuesday
- United
- United States
- us
- us congress
- US Debt
- US Dollar
- US Federal
- us federal reserve
- US Jobs Report
- US Treasury
- USD
- vs
- Wall
- Wall Street
- Warrants
- washington
- week
- What
- which
- while
- wholesale
- will
- without
- would
- would give
- writing
- yellen
- yields
- zephyrnet