- USD/JPY’s two weeks rally ex-post BoJ’s flexible YCC implementation has almost reached a key resistance zone of 145.50/146.10.
- Rising of concerns about another bout of verbal FX interventions from Ministry of Finance officials to talk down the USD/JPY at around the 145.00 psychological level.
- Short-term momentum has turned bearish, risk of downside mean reversion towards the 20-day moving average now acting as support at 141.85.
The ex-post effect of Bank of Japan (BoJ)’s flexible 10-year Japanese Government Bond (JGB) Yield Curve Control (YCC) announcement on the 28 July monetary policy meeting has led to a 716 pips rally (+5.2%) seen in the USD/JPY from its 28 July low of 138.55 to today, 14 August Asian session intraday high of 145.22.
Interestingly, the current intraday high of 145.22 coincided with a recent medium-term swing high of 145.07 printed on 30 June 2023 that witnessed drummed-up verbal FX intervention from Japan’s Ministry of Finance (MoF) officials to smooth out JPY weakness at the 145.00 psychology level of USD/JPY in the past.
No signs of verbal intervention so far from MoF officials, but current intraday price actions seen in today’s Asian session have suggested that such fears are rising in the marketplace, USD/JPY has attempted to push higher at the start of today’s Japan session with an intraday high print of 145.22 but bulls were not able to maintain their posture and drifted lower to 144.86, and record a current intraday loss of -0.08% at this time of the writing.
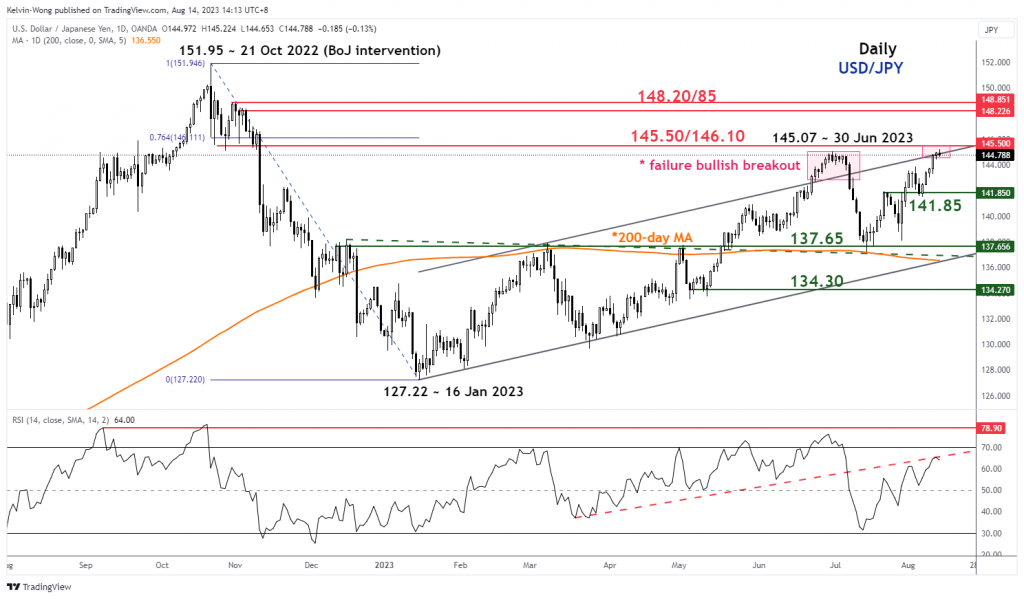
145.50/146.10 resistance is a key area of confluence
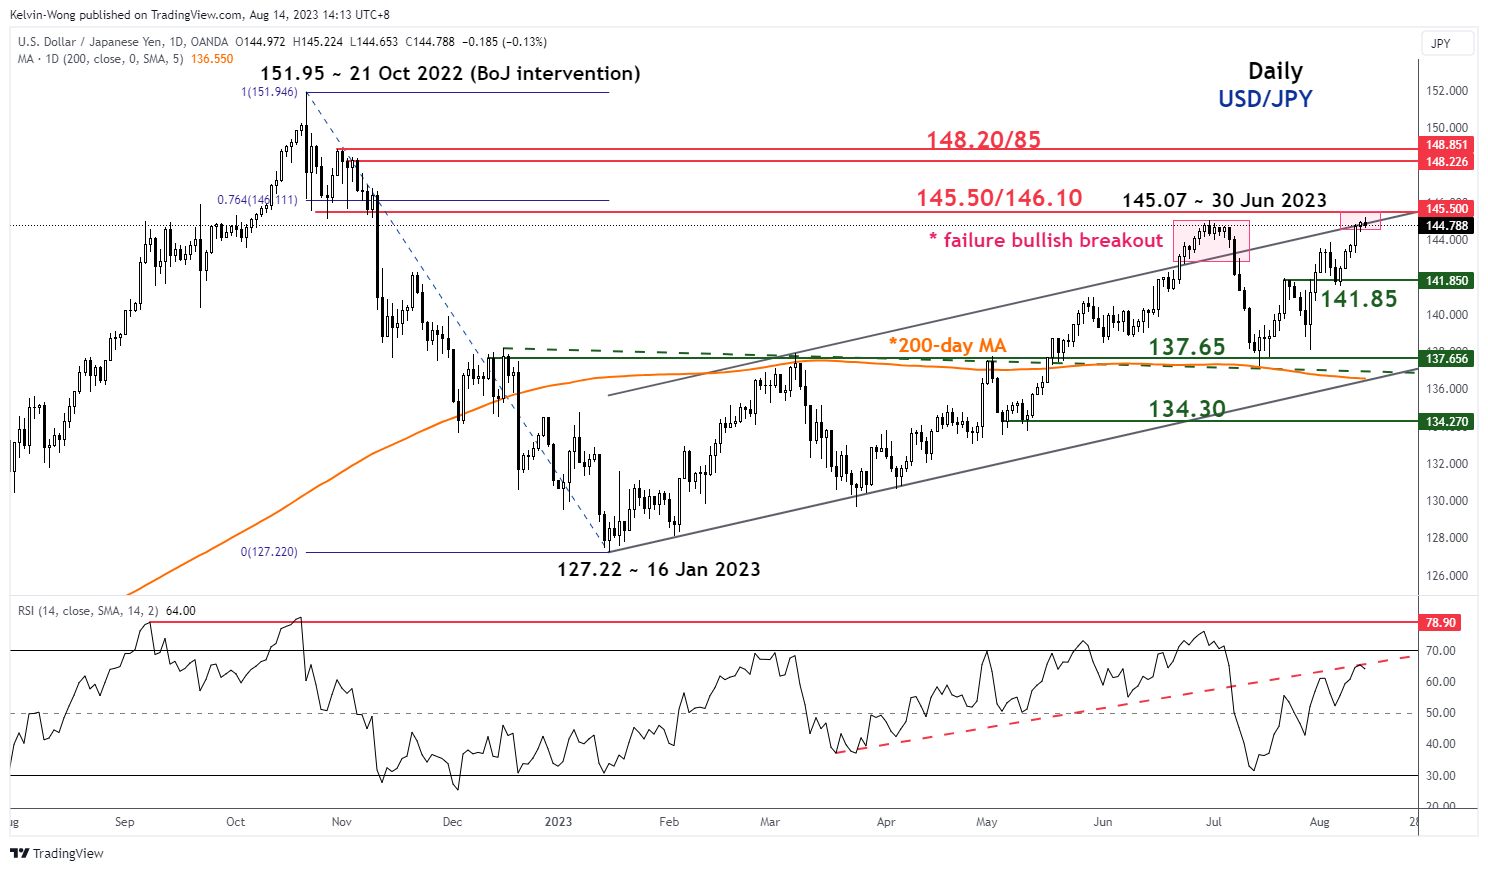
Fig 1: USD/JPY medium-term trend as of 14 Aug 2023 (Source: TradingView, click to enlarge chart)
Today’s Asian session push-up in price actions has led the USD/JPY to retest the upper boundary of the medium-term ascending channel in place since the 16 January 2023 low of 127.22, the former swing low areas of 24 October/2 November 2022, and the 76.4% Fibonacci retracement of the prior medium-term downtrend phase from 21 October 2022 high to 16 January 2023 low which confluences at the 145.50/141.10 resistance zone.
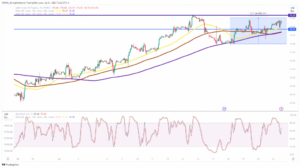
Short-term momentum has turned bearish
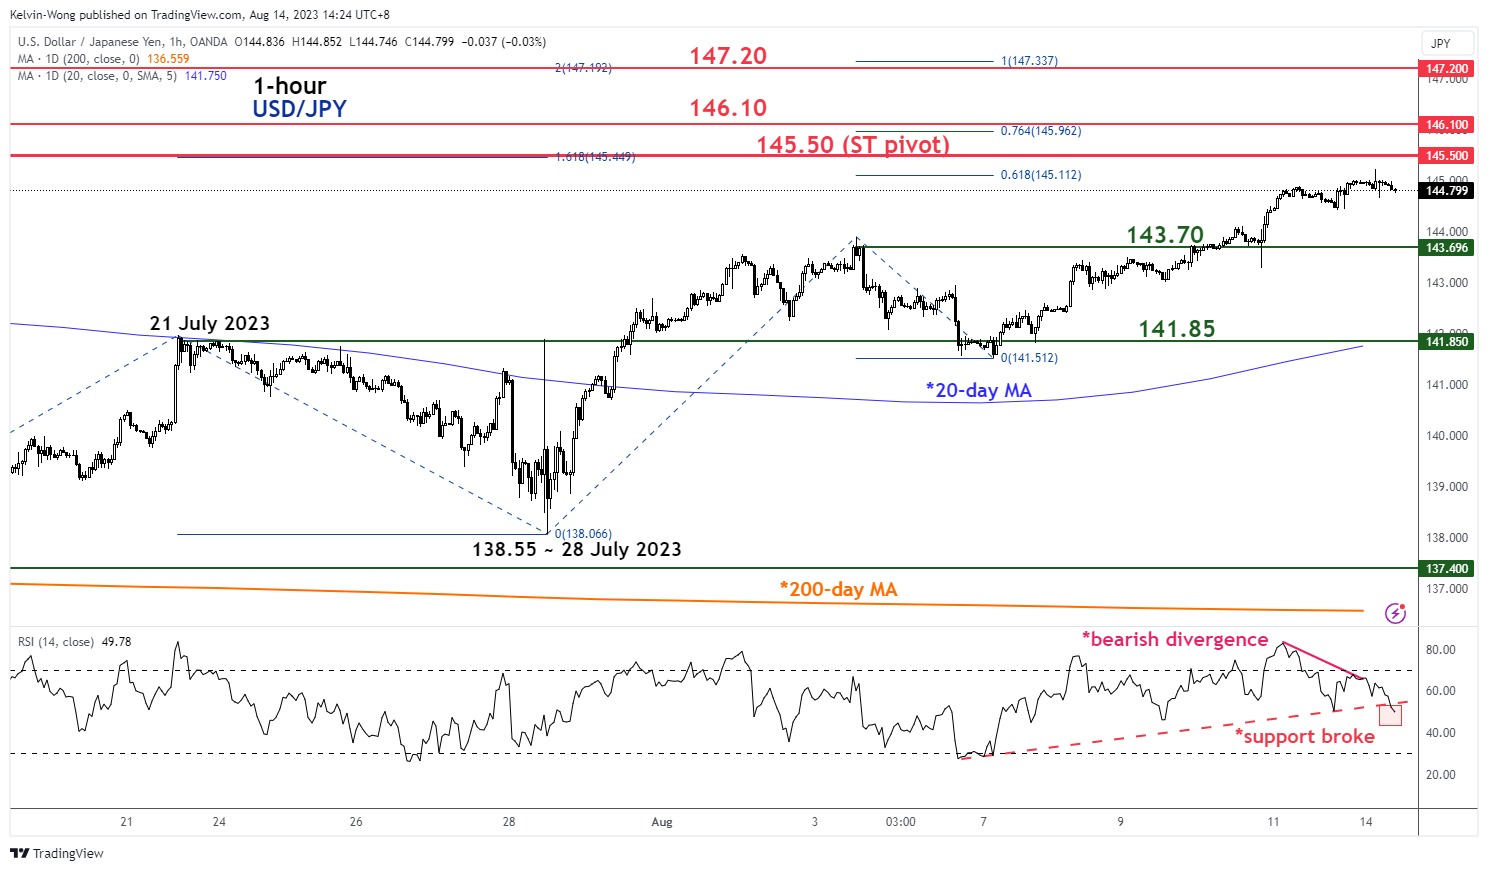
Fig 2: USD/JPY minor short-term trend as of 14 Aug 2023 (Source: TradingView, click to enlarge chart)
The hourly RSI oscillator has started to stage a breakdown below its parallel ascending support at the 54 level after a prior bearish divergence condition was flashed out last Friday, 11 August.
Watch the 145.50 key short-term pivotal resistance and a break below the intermediate support of 143.70 exposes the next support at 141.85 (also the 20-day moving average).
On the other hand, a clearance above 145.50 sees 146.10 next, and a break above it may propel it higher toward the next resistance at 147.20 (Fibonacci extension cluster).
Content is for general information purposes only. It is not investment advice or a solution to buy or sell securities. Opinions are the authors; not necessarily that of OANDA Business Information & Services, Inc. or any of its affiliates, subsidiaries, officers or directors. If you would like to reproduce or redistribute any of the content found on MarketPulse, an award winning forex, commodities and global indices analysis and news site service produced by OANDA Business Information & Services, Inc., please access the RSS feed or contact us at info@marketpulse.com. Visit https://www.marketpulse.com/ to find out more about the beat of the global markets. © 2023 OANDA Business Information & Services Inc.
Latest posts by Kelvin Wong (see all)
- SEO Powered Content & PR Distribution. Get Amplified Today.
- PlatoData.Network Vertical Generative Ai. Empower Yourself. Access Here.
- PlatoAiStream. Web3 Intelligence. Knowledge Amplified. Access Here.
- PlatoESG. Automotive / EVs, Carbon, CleanTech, Energy, Environment, Solar, Waste Management. Access Here.
- PlatoHealth. Biotech and Clinical Trials Intelligence. Access Here.
- ChartPrime. Elevate your Trading Game with ChartPrime. Access Here.
- BlockOffsets. Modernizing Environmental Offset Ownership. Access Here.
- Source: https://www.marketpulse.com/forex/usd-jpy-technical-lethargic-bulls-below-145-50/kwong
- :has
- :is
- :not
- 07
- 1
- 10
- 11
- 14
- 15 years
- 15%
- 16
- 2%
- 20
- 2022
- 2023
- 22
- 24
- 28
- 30
- 50
- 70
- 700
- a
- Able
- About
- above
- access
- acting
- actions
- addition
- advice
- affiliates
- After
- also
- an
- analysis
- and
- Announcement
- Another
- any
- ARE
- AREA
- areas
- around
- AS
- asian
- At
- attempted
- Aug
- AUGUST
- author
- authors
- avatar
- average
- award
- Bank
- bank of japan
- bearish
- bearish divergence
- below
- boj
- bond
- Box
- Break
- Breakdown
- Bulls
- business
- but
- buttons
- buy
- by
- Channel
- Chart
- click
- Cluster
- coincided
- COM
- combination
- Commodities
- Concerns
- condition
- conducted
- Connecting
- contact
- content
- control
- courses
- Current
- curve
- Directors
- Divergence
- down
- downside
- effect
- Elliott
- enlarge
- Ether (ETH)
- exchange
- experience
- expert
- extension
- far
- fears
- Fibonacci
- finance
- financial
- Find
- flexible
- flow
- For
- foreign
- foreign exchange
- forex
- Former
- found
- Friday
- from
- fund
- fundamental
- FX
- General
- Global
- global markets
- Government
- hand
- Have
- High
- higher
- HTTPS
- if
- implementation
- in
- Inc.
- Indices
- information
- Intermediate
- intervention
- interventions
- investment
- IT
- ITS
- January
- Japan
- Japan’s
- Japanese
- JGB
- JPY
- July
- june
- Kelvin
- Key
- key resistance
- Last
- Led
- Level
- levels
- like
- loss
- Low
- lower
- Macro
- maintain
- Market
- market outlook
- market research
- marketplace
- MarketPulse
- Markets
- max-width
- May..
- mean
- Mean Reversion
- meeting
- ministry
- minor
- Momentum
- Monetary
- Monetary Policy
- more
- moving
- moving average
- necessarily
- news
- next
- November
- now
- numerous
- october
- of
- officers
- officials
- on
- only
- Opinions
- or
- Other
- out
- Outlook
- over
- Parallel
- passionate
- past
- perspectives
- phase
- photo
- pivotal
- Place
- plato
- Plato Data Intelligence
- PlatoData
- please
- policy
- positioning
- Posts
- price
- Prior
- Produced
- Propel
- providing
- Psychology
- purposes
- Push
- rally
- reached
- recent
- record
- research
- Resistance
- retail
- retracement
- Reversal
- rising
- Risk
- rsi
- rss
- Securities
- seen
- sees
- sell
- senior
- service
- Services
- session
- sharing
- short-term
- Signs
- since
- Singapore
- site
- smooth
- So
- so Far
- solution
- Source
- specializing
- Stage
- start
- started
- stock
- Stock markets
- Strategist
- such
- support
- Swing
- Talk
- Technical
- Technical Analysis
- ten
- that
- The
- their
- this
- thousands
- time
- to
- today
- today’s
- toward
- towards
- Traders
- Trading
- TradingView
- Training
- Trend
- Turned
- two
- unique
- us
- USD/JPY
- using
- v1
- Visit
- was
- Wave
- weakness
- Weeks
- WELL
- were
- which
- winning
- with
- witnessed
- wong
- would
- writing
- years
- Yield
- yield curve
- yield curve control
- you
- zephyrnet