Sign up for daily news updates from CleanTechnica on email. Or follow us on Google News!
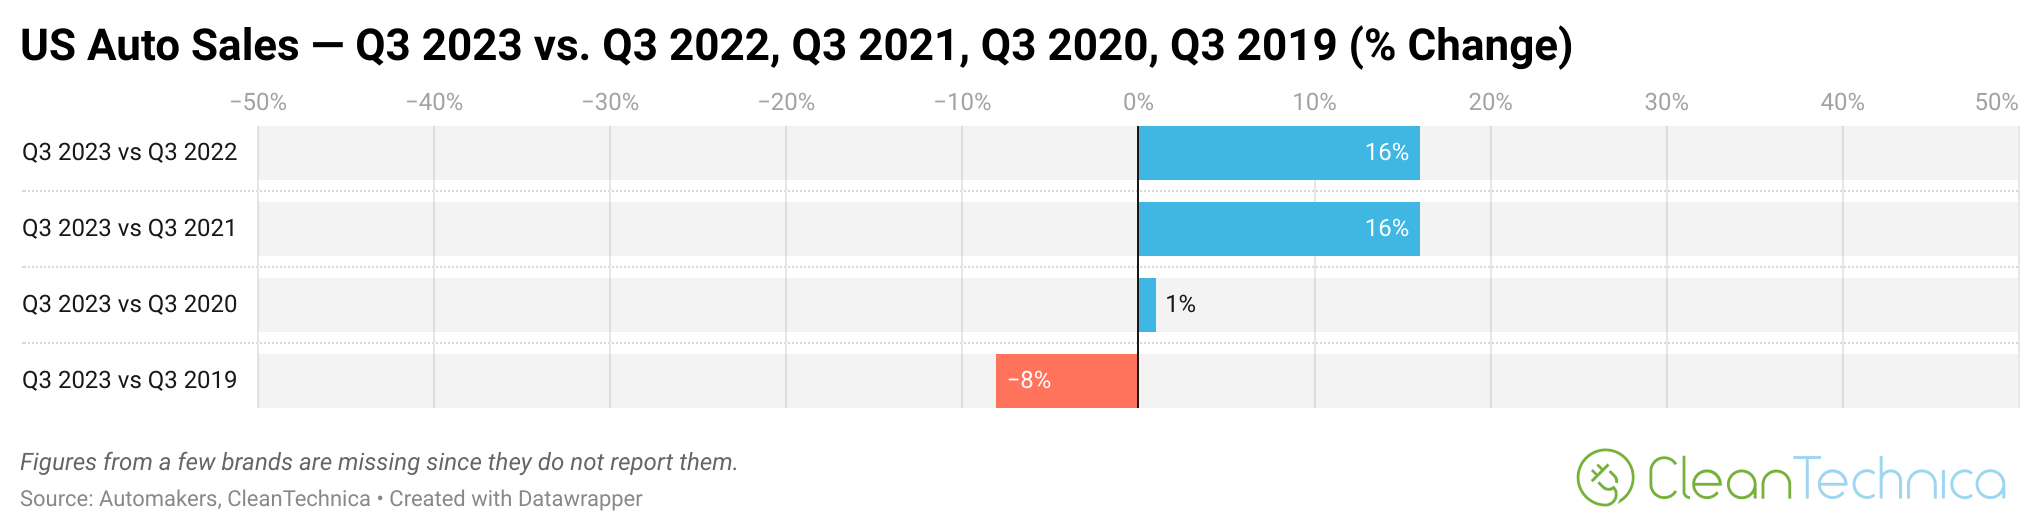
The US auto industry is bouncing back compared to the past couple of years, but it’s still significantly below its pre-COVID days. Sales in the 3rd quarter of 2023 were 16% higher than sales in the 3rd quarter of 2022 and the 3rd quarter of 2021. However, they were only 1% higher than Q3 2020 sales and they were 8% below Q3 2019 sales. The question is: do the challenges of higher interest rates, depressed post-pandemic economic conditions, and supply chain challenges continue to keep sales down, or has the industry just shifted away from such high levels of auto purchasing and 2019 was from a peak sales period we won’t see again?
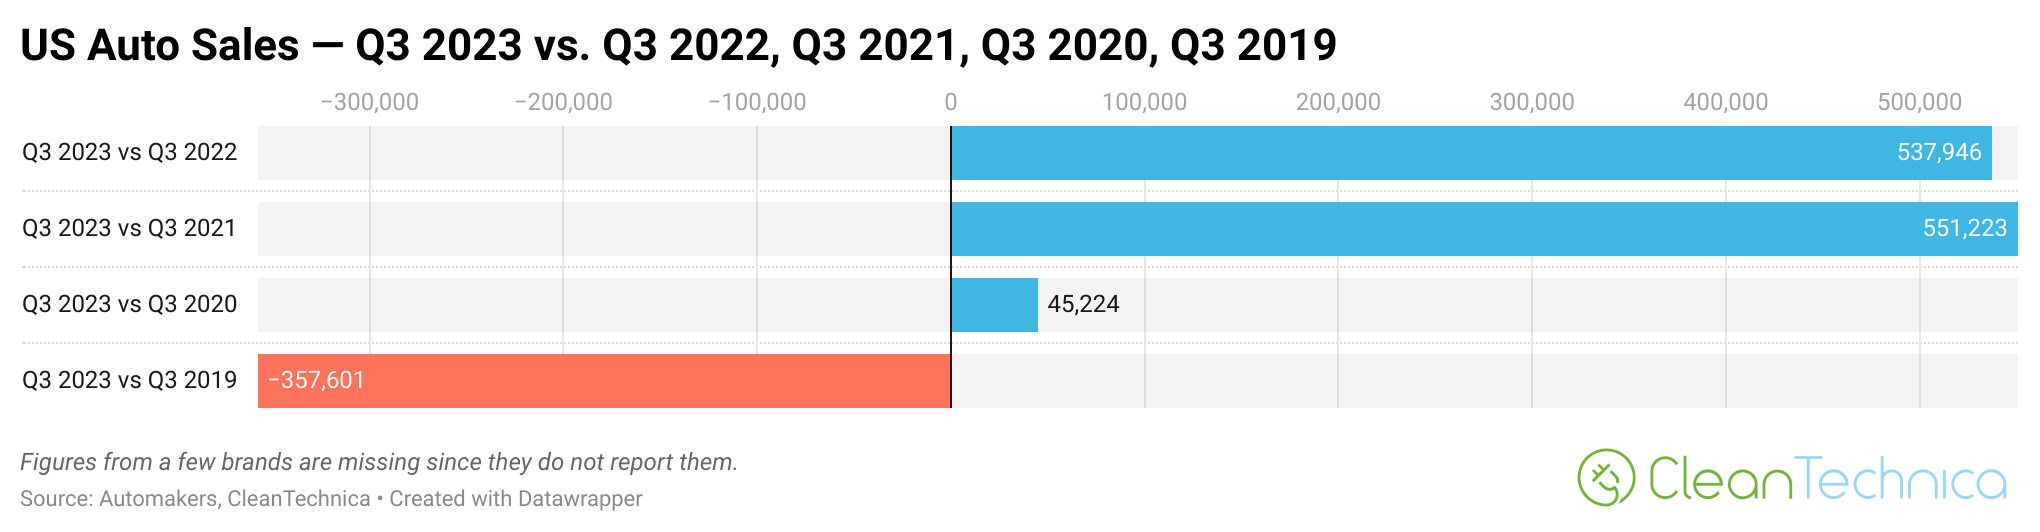
Looking at the chart just above that shows the changes in volume terms, you can see that US auto sales in Q3 2023 were more than half a million units above Q3 2022 and Q3 2021. Nonetheless, they were still 357,601 units below Q3 2019.
I’m quite curious to see how the 4th quarter will look relative to recent years.
Also, note that full electric vehicle (BEV) sales in the US were up 44% compared to Q3 2022 and up 143% compared to Q3 2021. So, the EV industry continues to grow faster than the auto industry as a whole. Approximately 7.5% of US auto industry sales were BEV sales last quarter, with 7 legacy auto brands surpassing that figure: Audi (12.7%), Volkswagen (12.2%), Mercedes (11.6%), Porsche (10.3%), Volvo (9.5%), Cadillac (8.5%), and Hyundai (8.3%). But let’s get back to the overall auto brand trends.
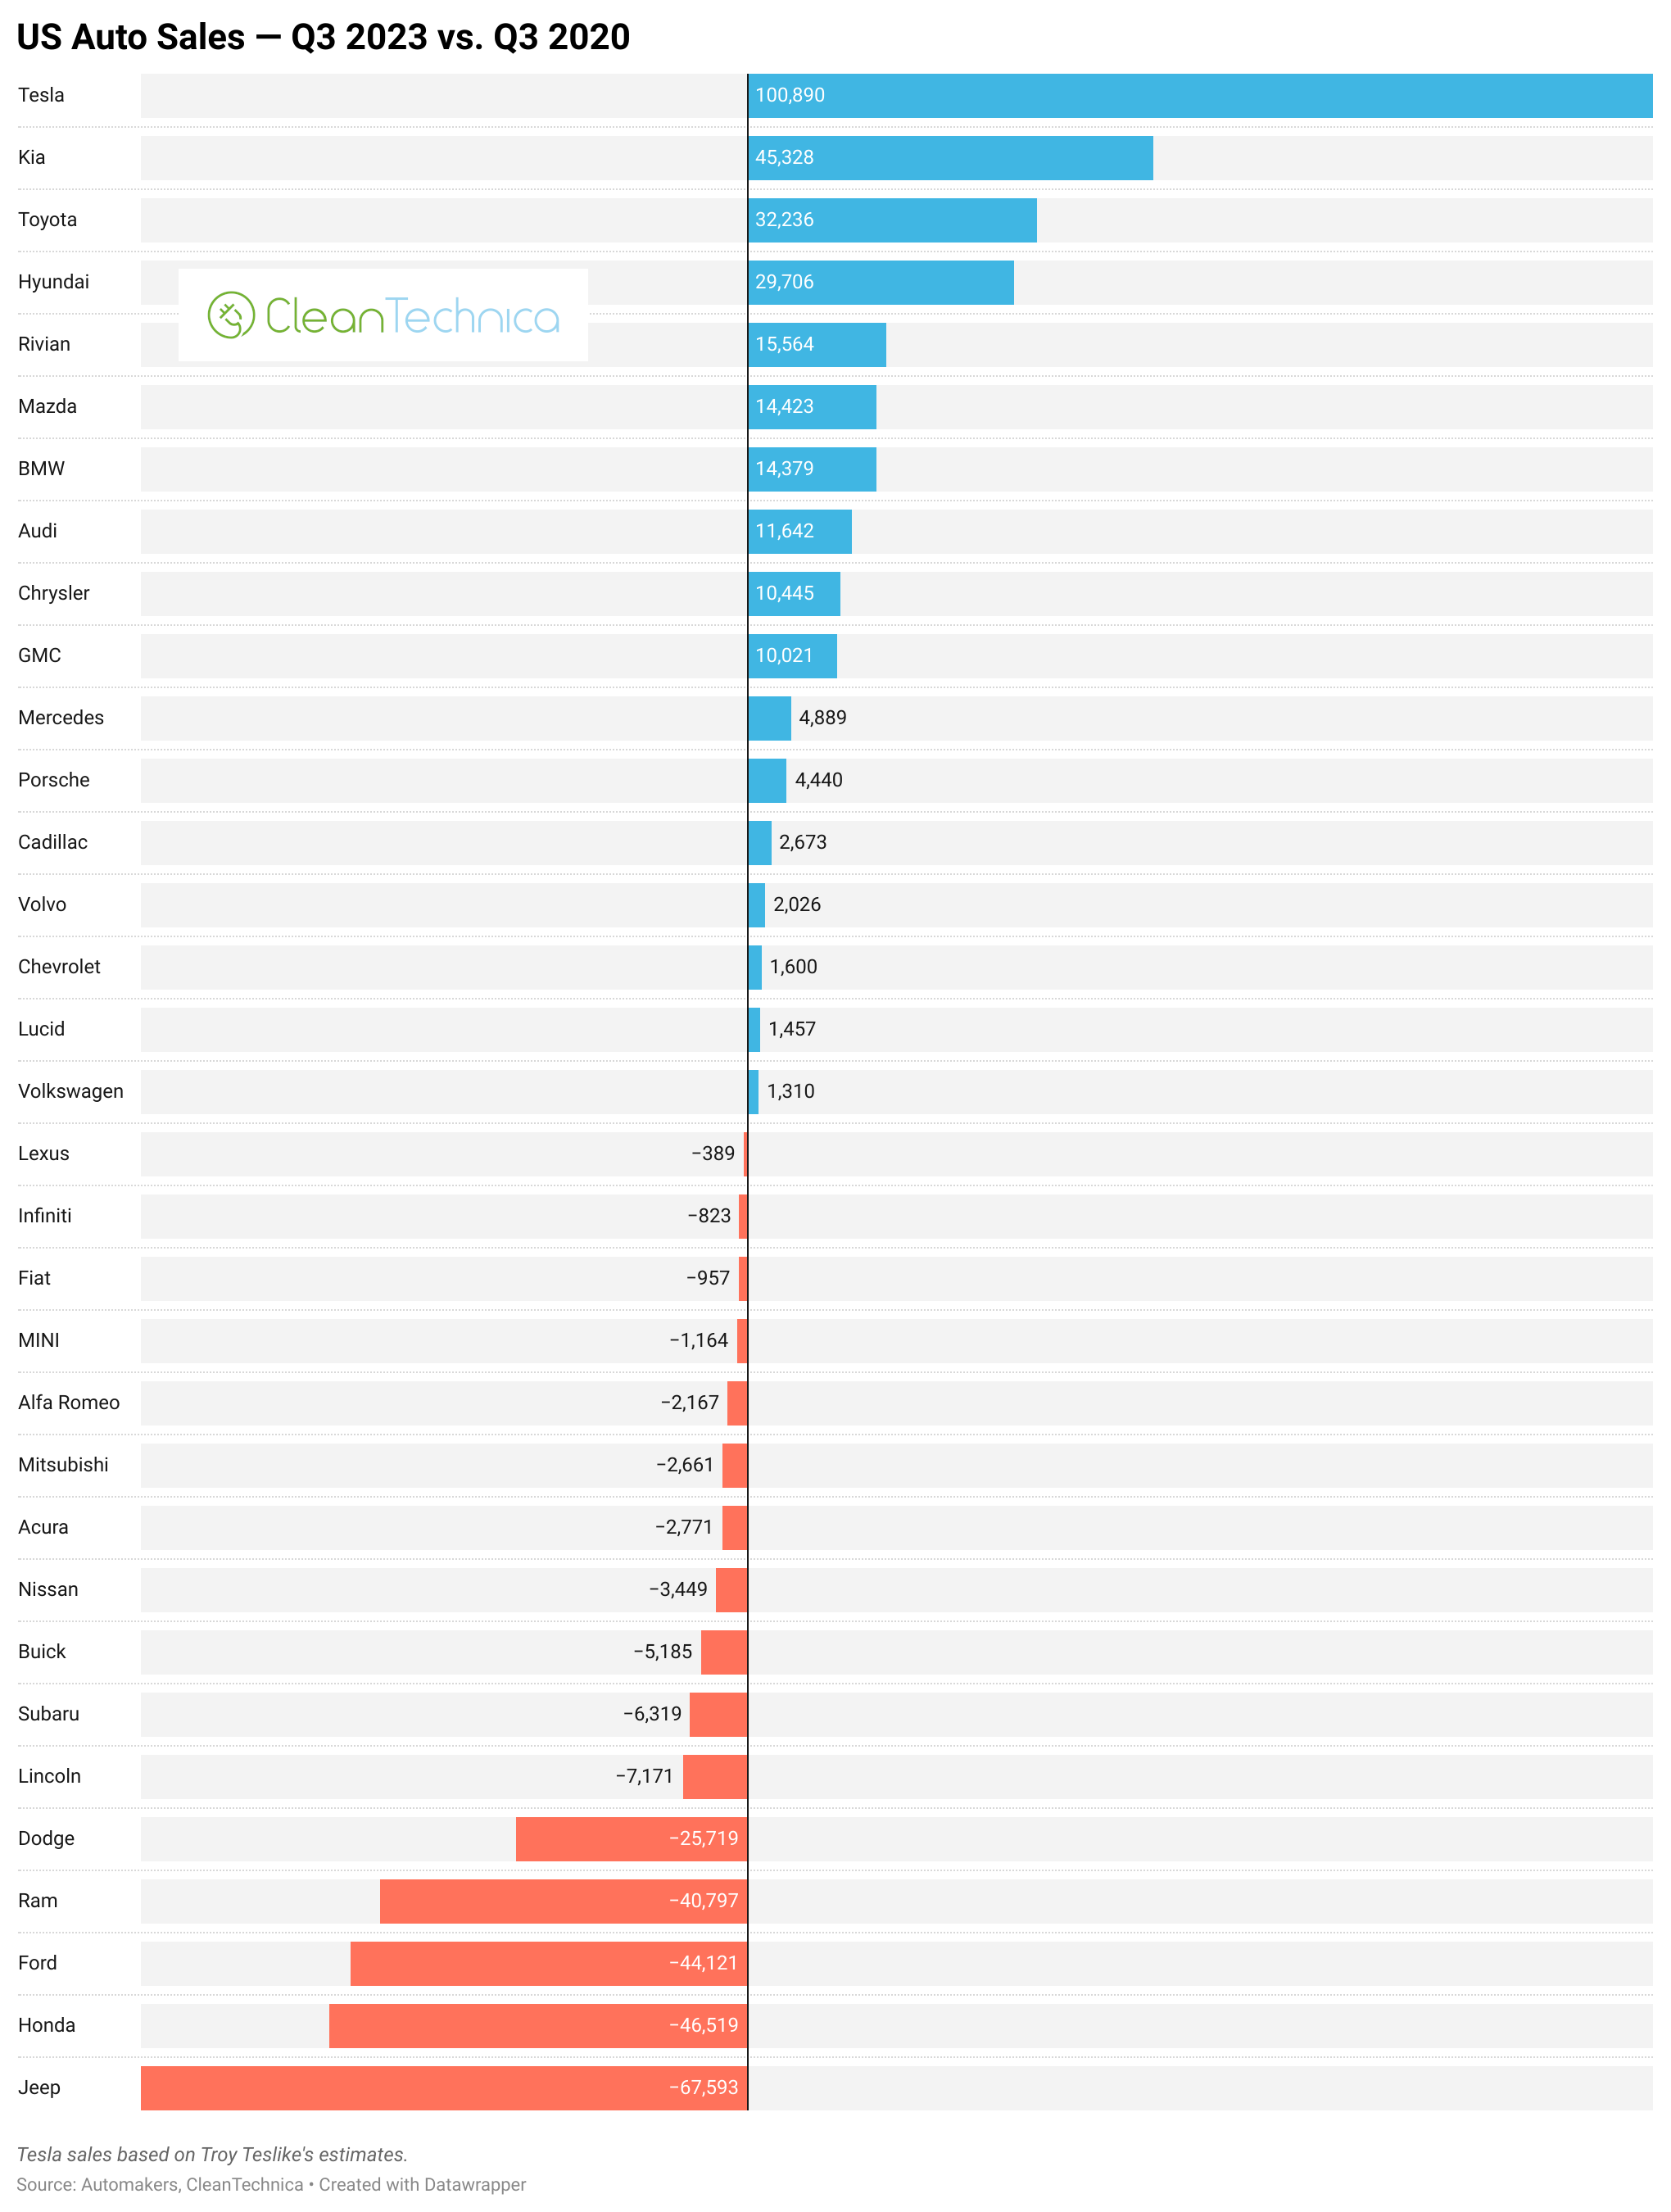
As you can see above and below, the brands that are up compared to Q3 2019 are Tesla (up 229%), Kia, Hyundai, Mazda, Chrysler, Porsche, Volvo, Audi (barely), GMC (barely), BMW (very barely), Lexus (very barely), and Mercedes (very, very barely). And, of course, there are a couple of new brands that are up from zero sales in 2019 — Rivian and Lucid, both pure electric vehicle brands.
The big losers in terms of of volume sales drops since Q3 2019 are Nissan, Jeep, Honda, Ford, Dodge, and Chevrolet (all with a sales drop of more than 50,000 vehicles). In percentage terms, Fiat (-94%), Dodge (-56%), Jeep (-37%), Nissan (-34%), Infiniti (-33%), and Alfa Romeo (-33%).
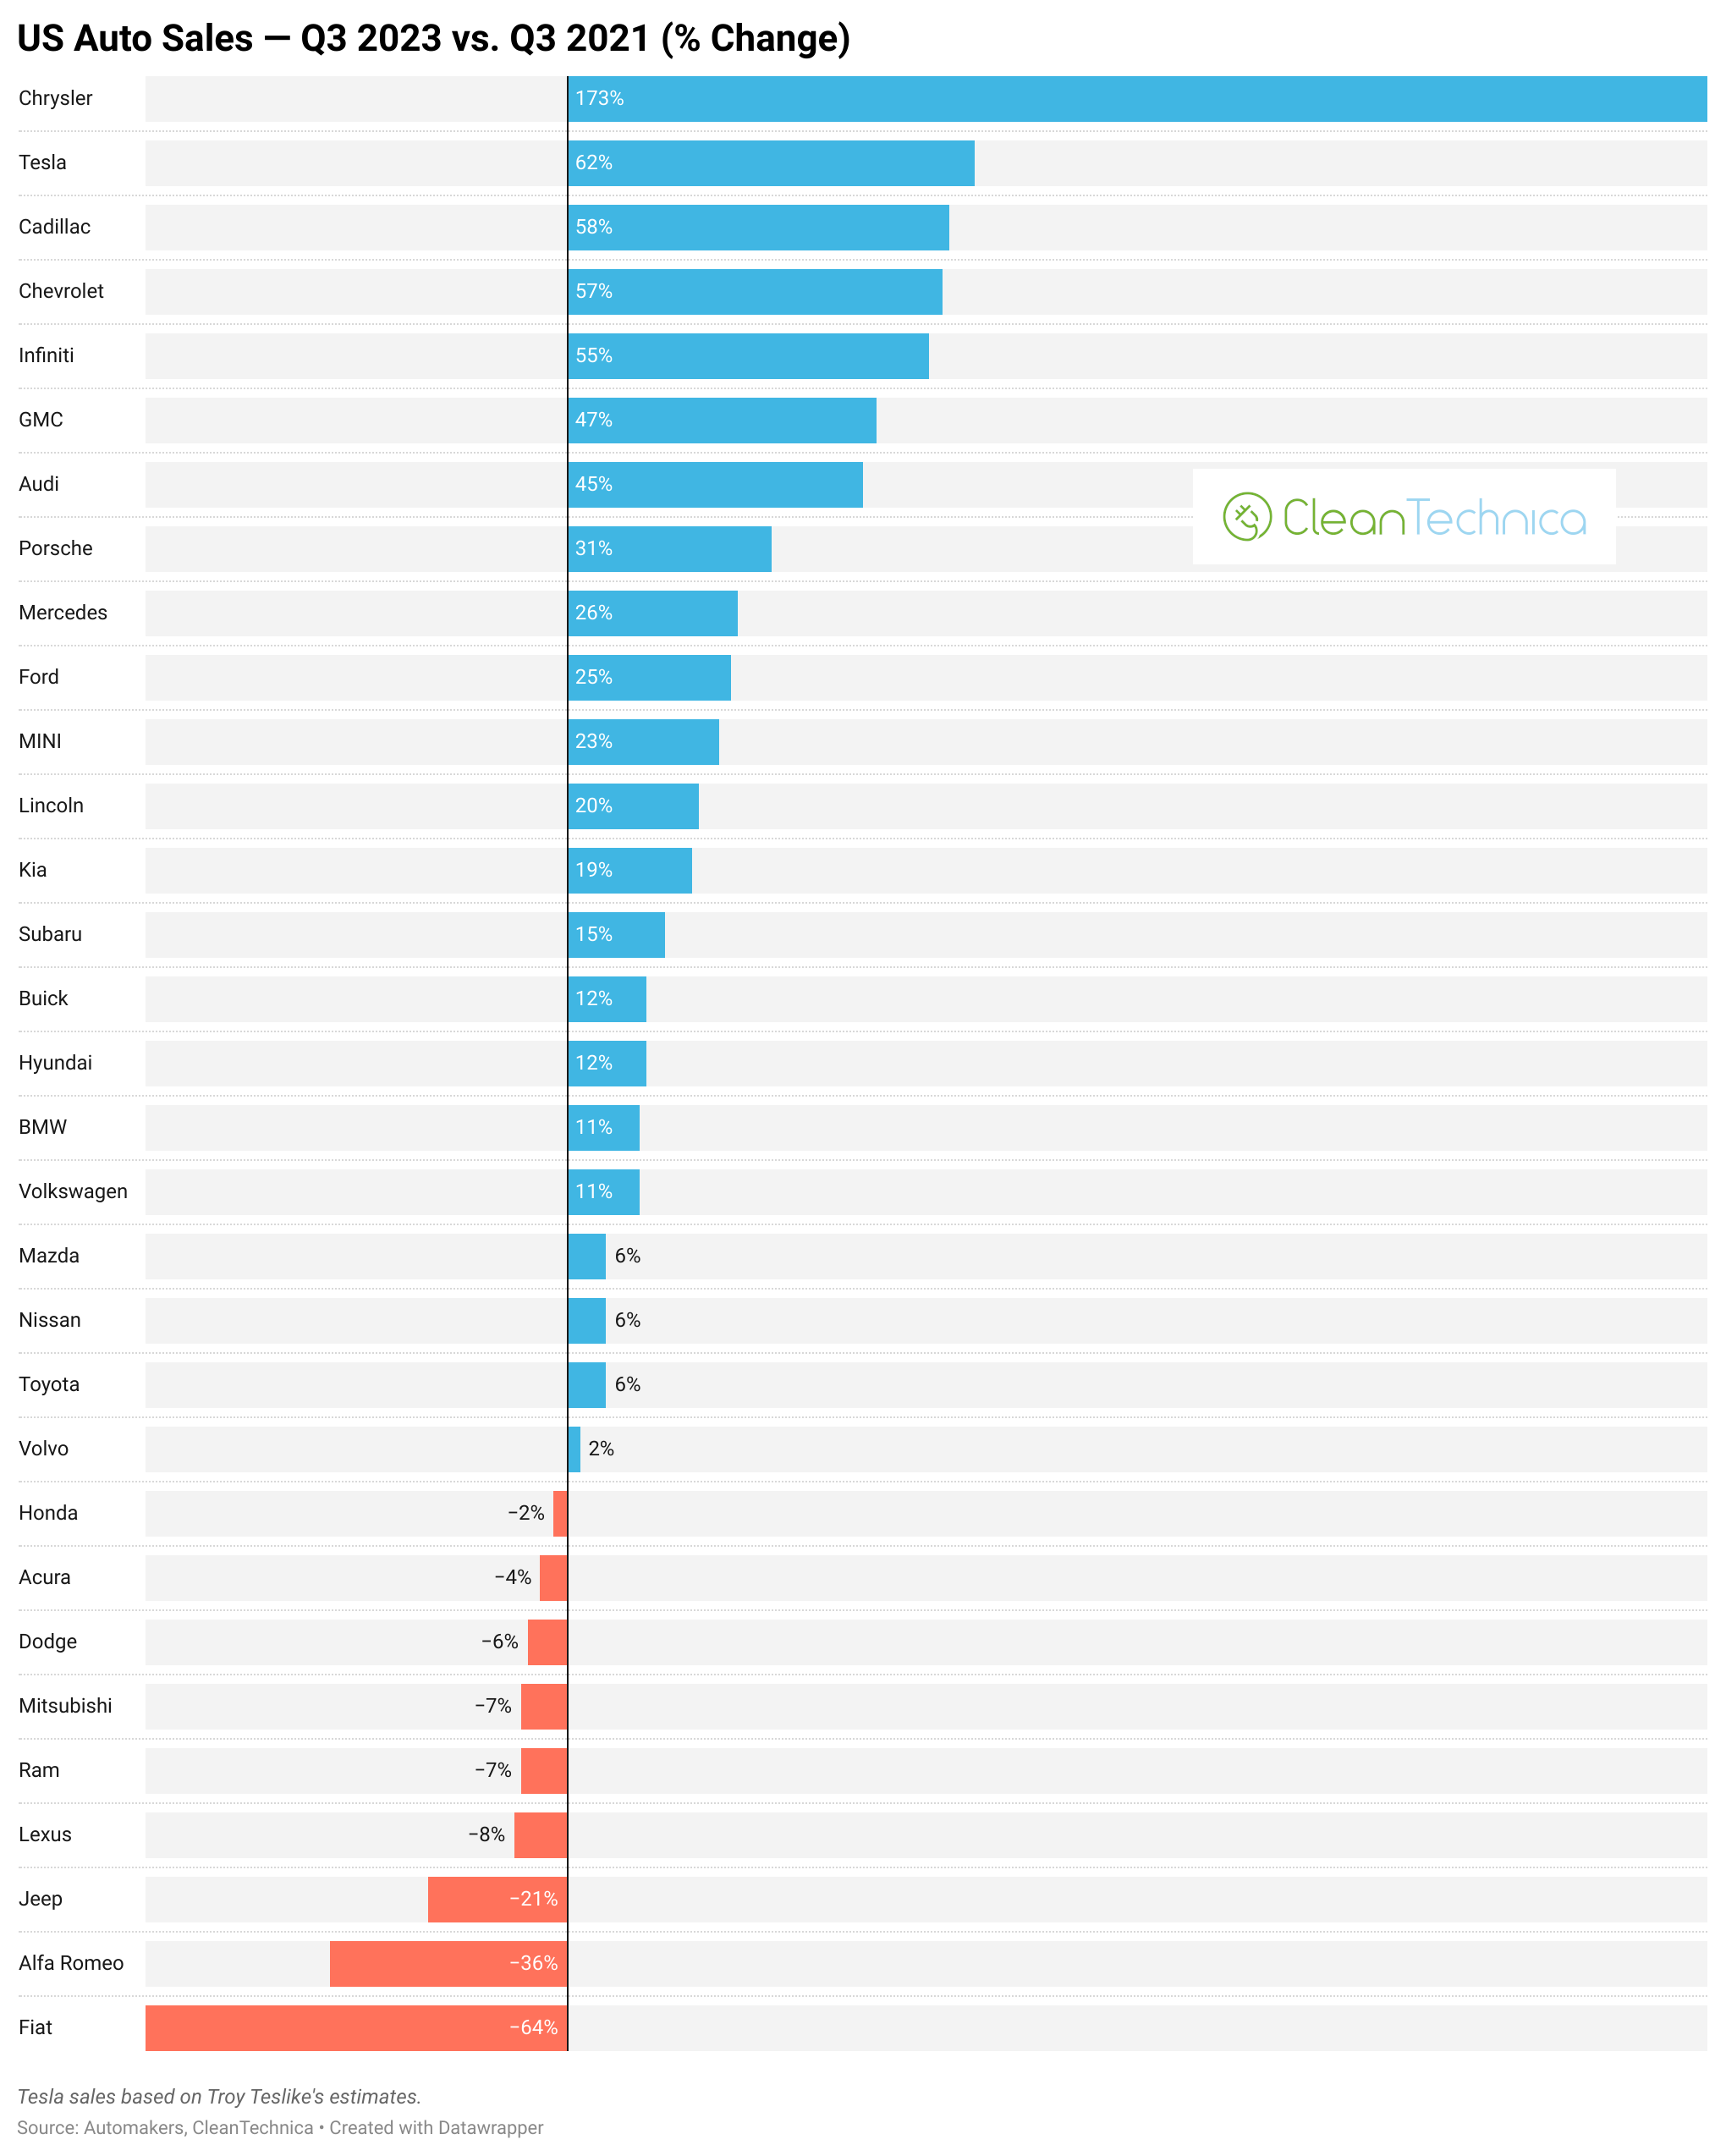
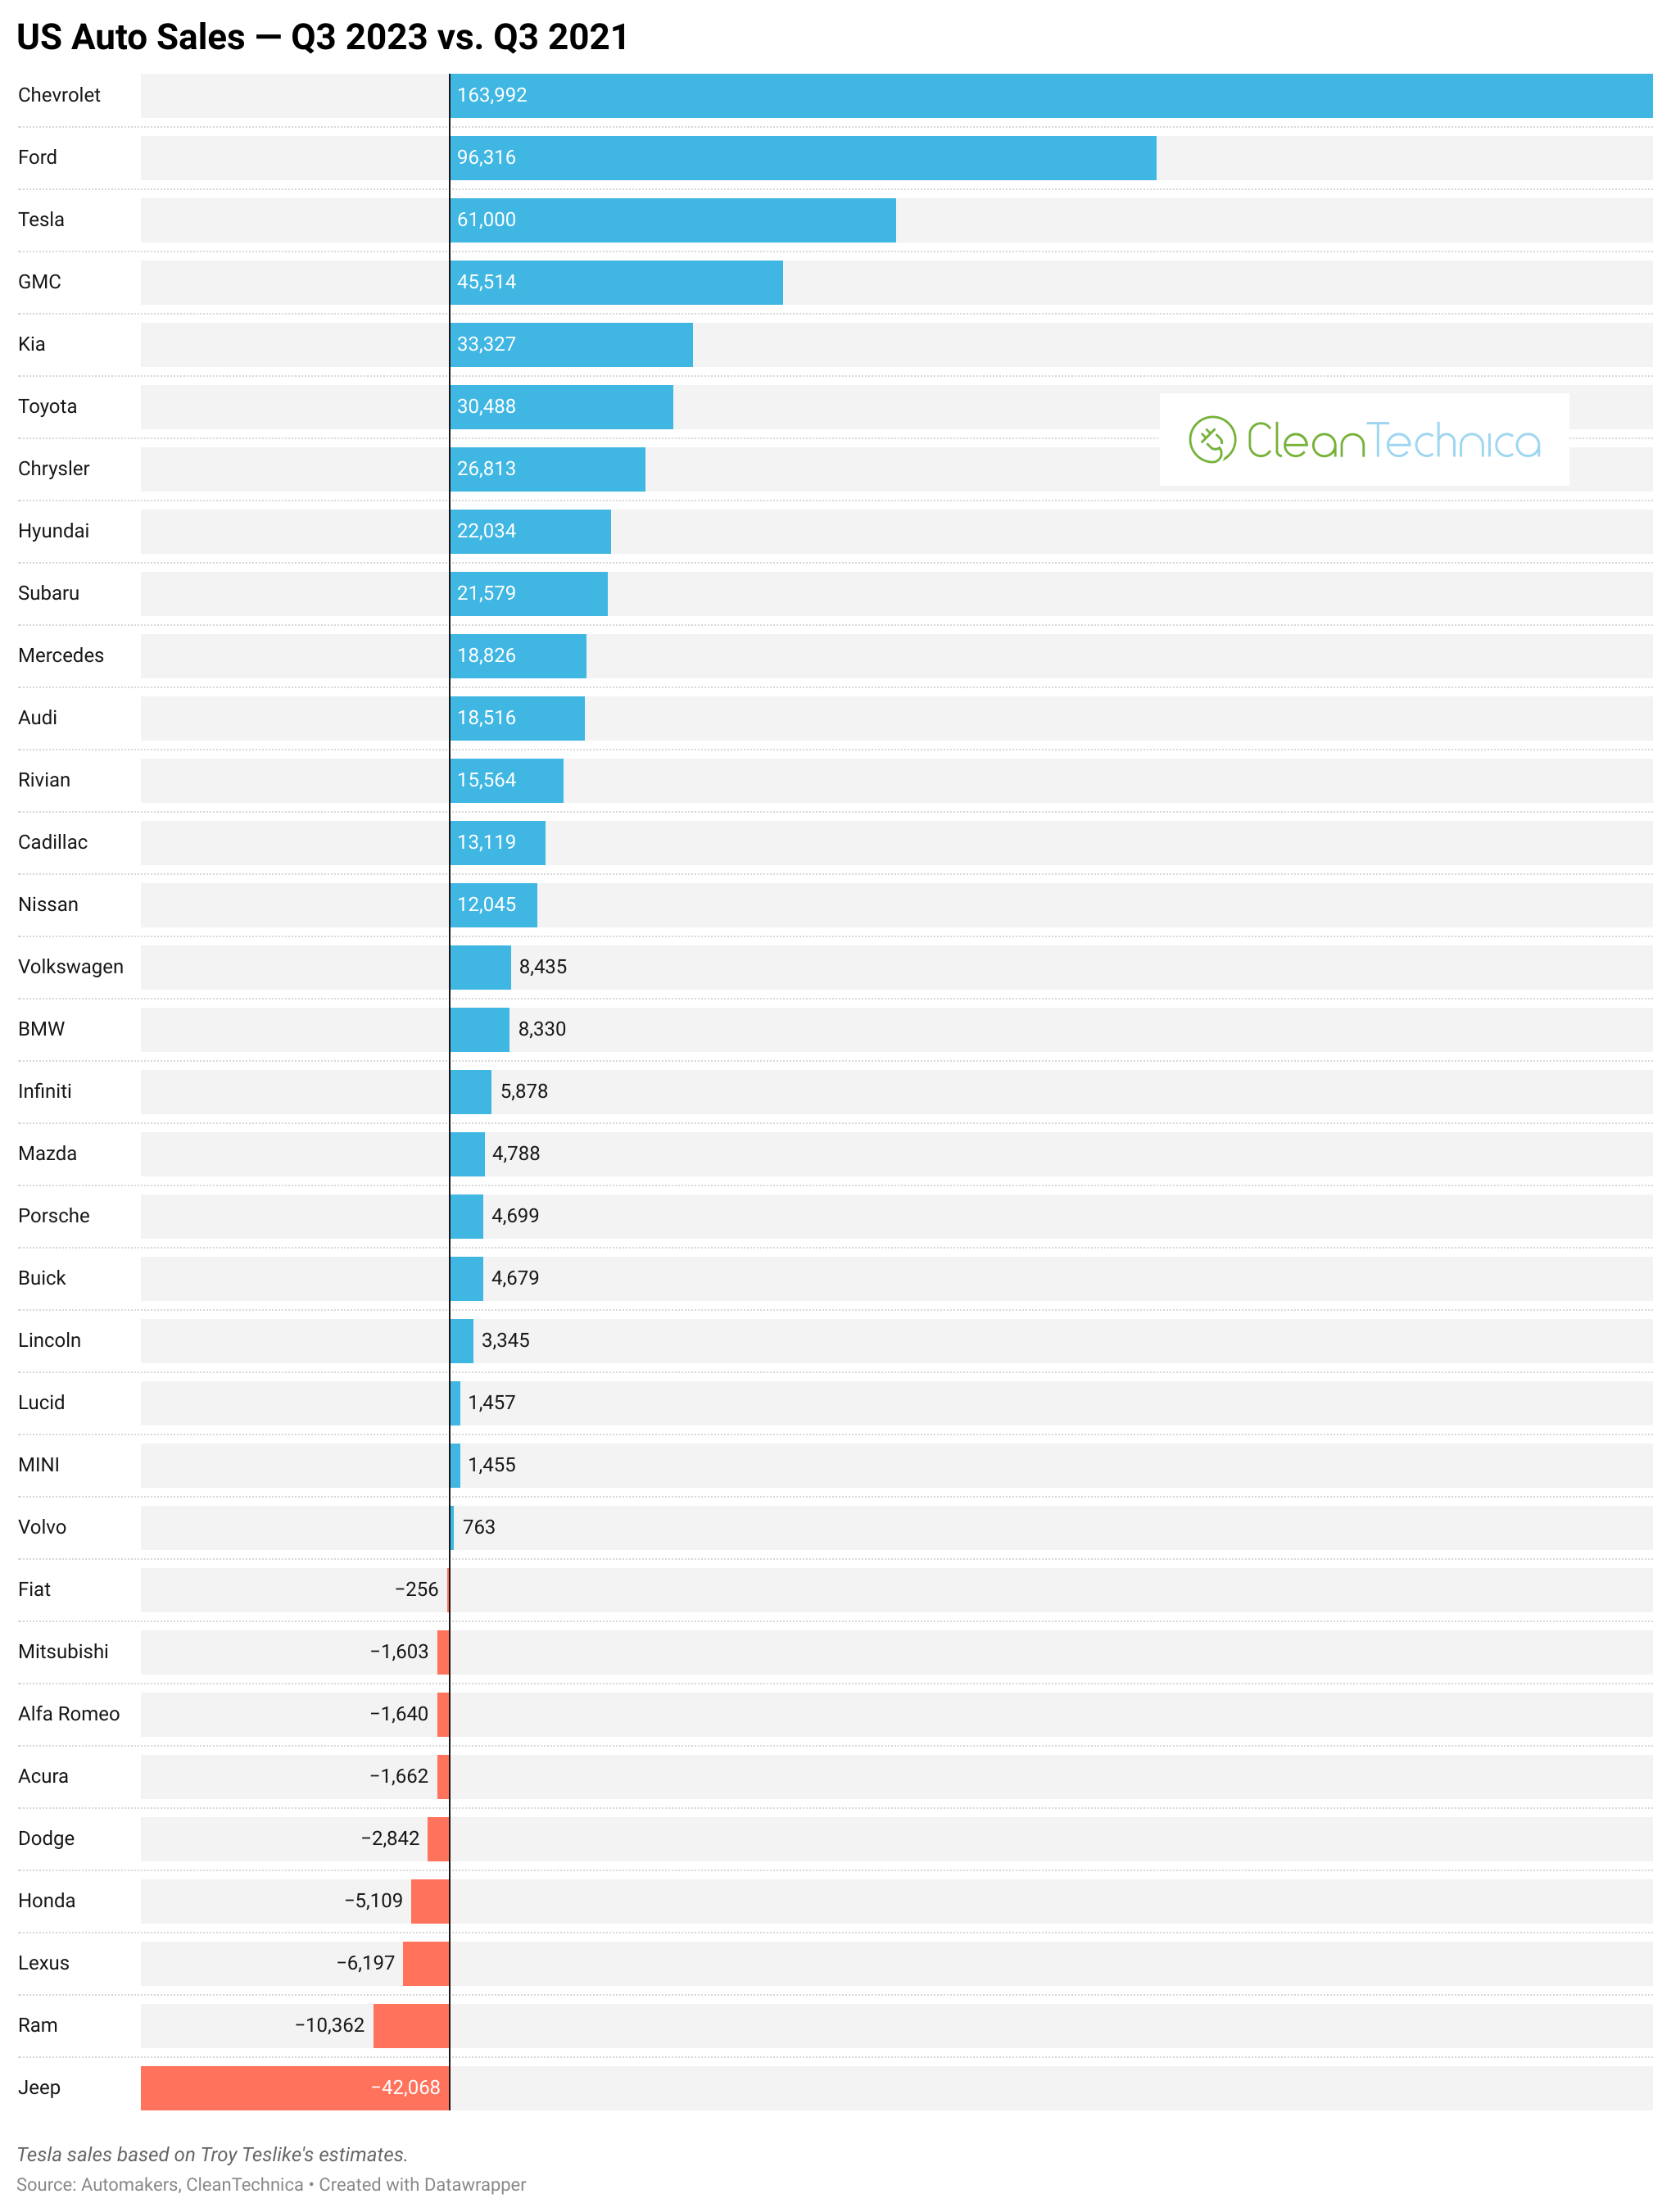
You can scroll through the charts above comparing Q3 2023 to Q3 2020 and Q3 2021 for more fun, but I’m going to jump down now to a comparison to last year. What’s fun and exciting to see is that another pure BEV company topped the growth charts here for percentage growth — Rivian sales were up 136% year over year. Otherwise, several models were up solidly — Chrysler (96%), Buick (54%), Honda (51%), Volvo (49%), Infiniti (47%), Nissan (40%), Mitsubishi (32%), Mazda (22%), Tesla (22%), and several others. As we can see, though, Tesla’s growth was not up anywhere close to the 50% the company has been targeting globally.
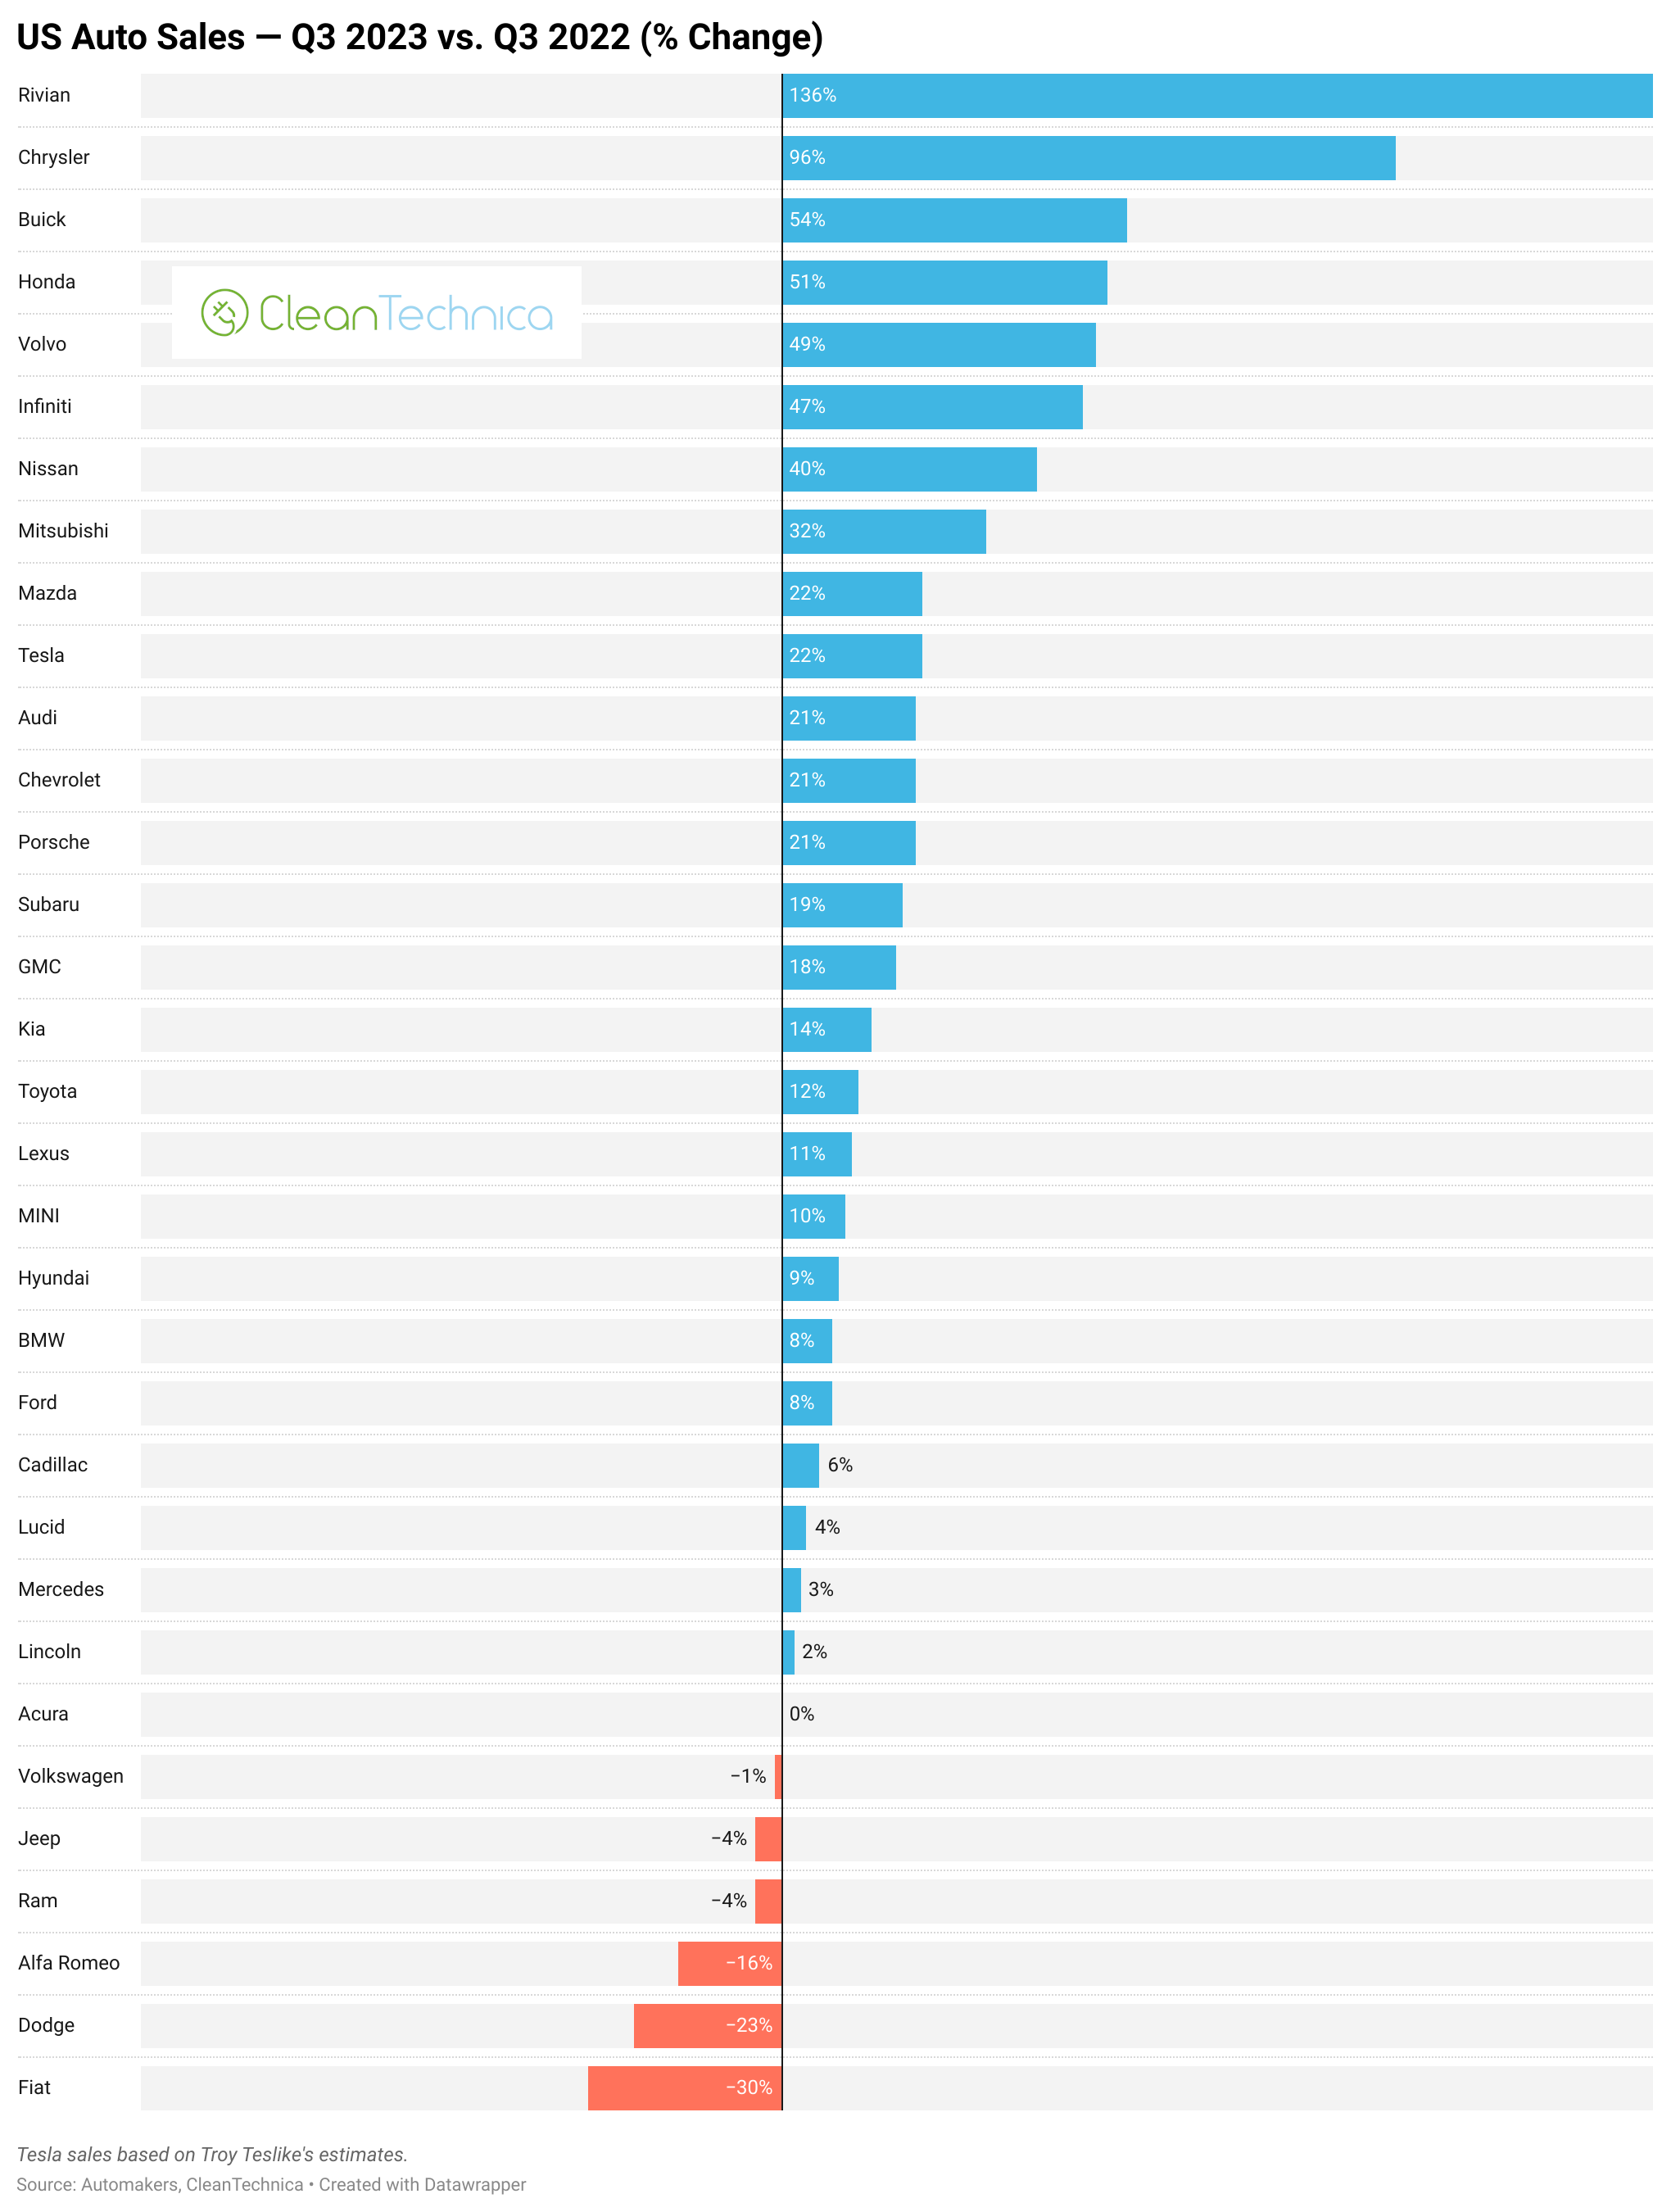
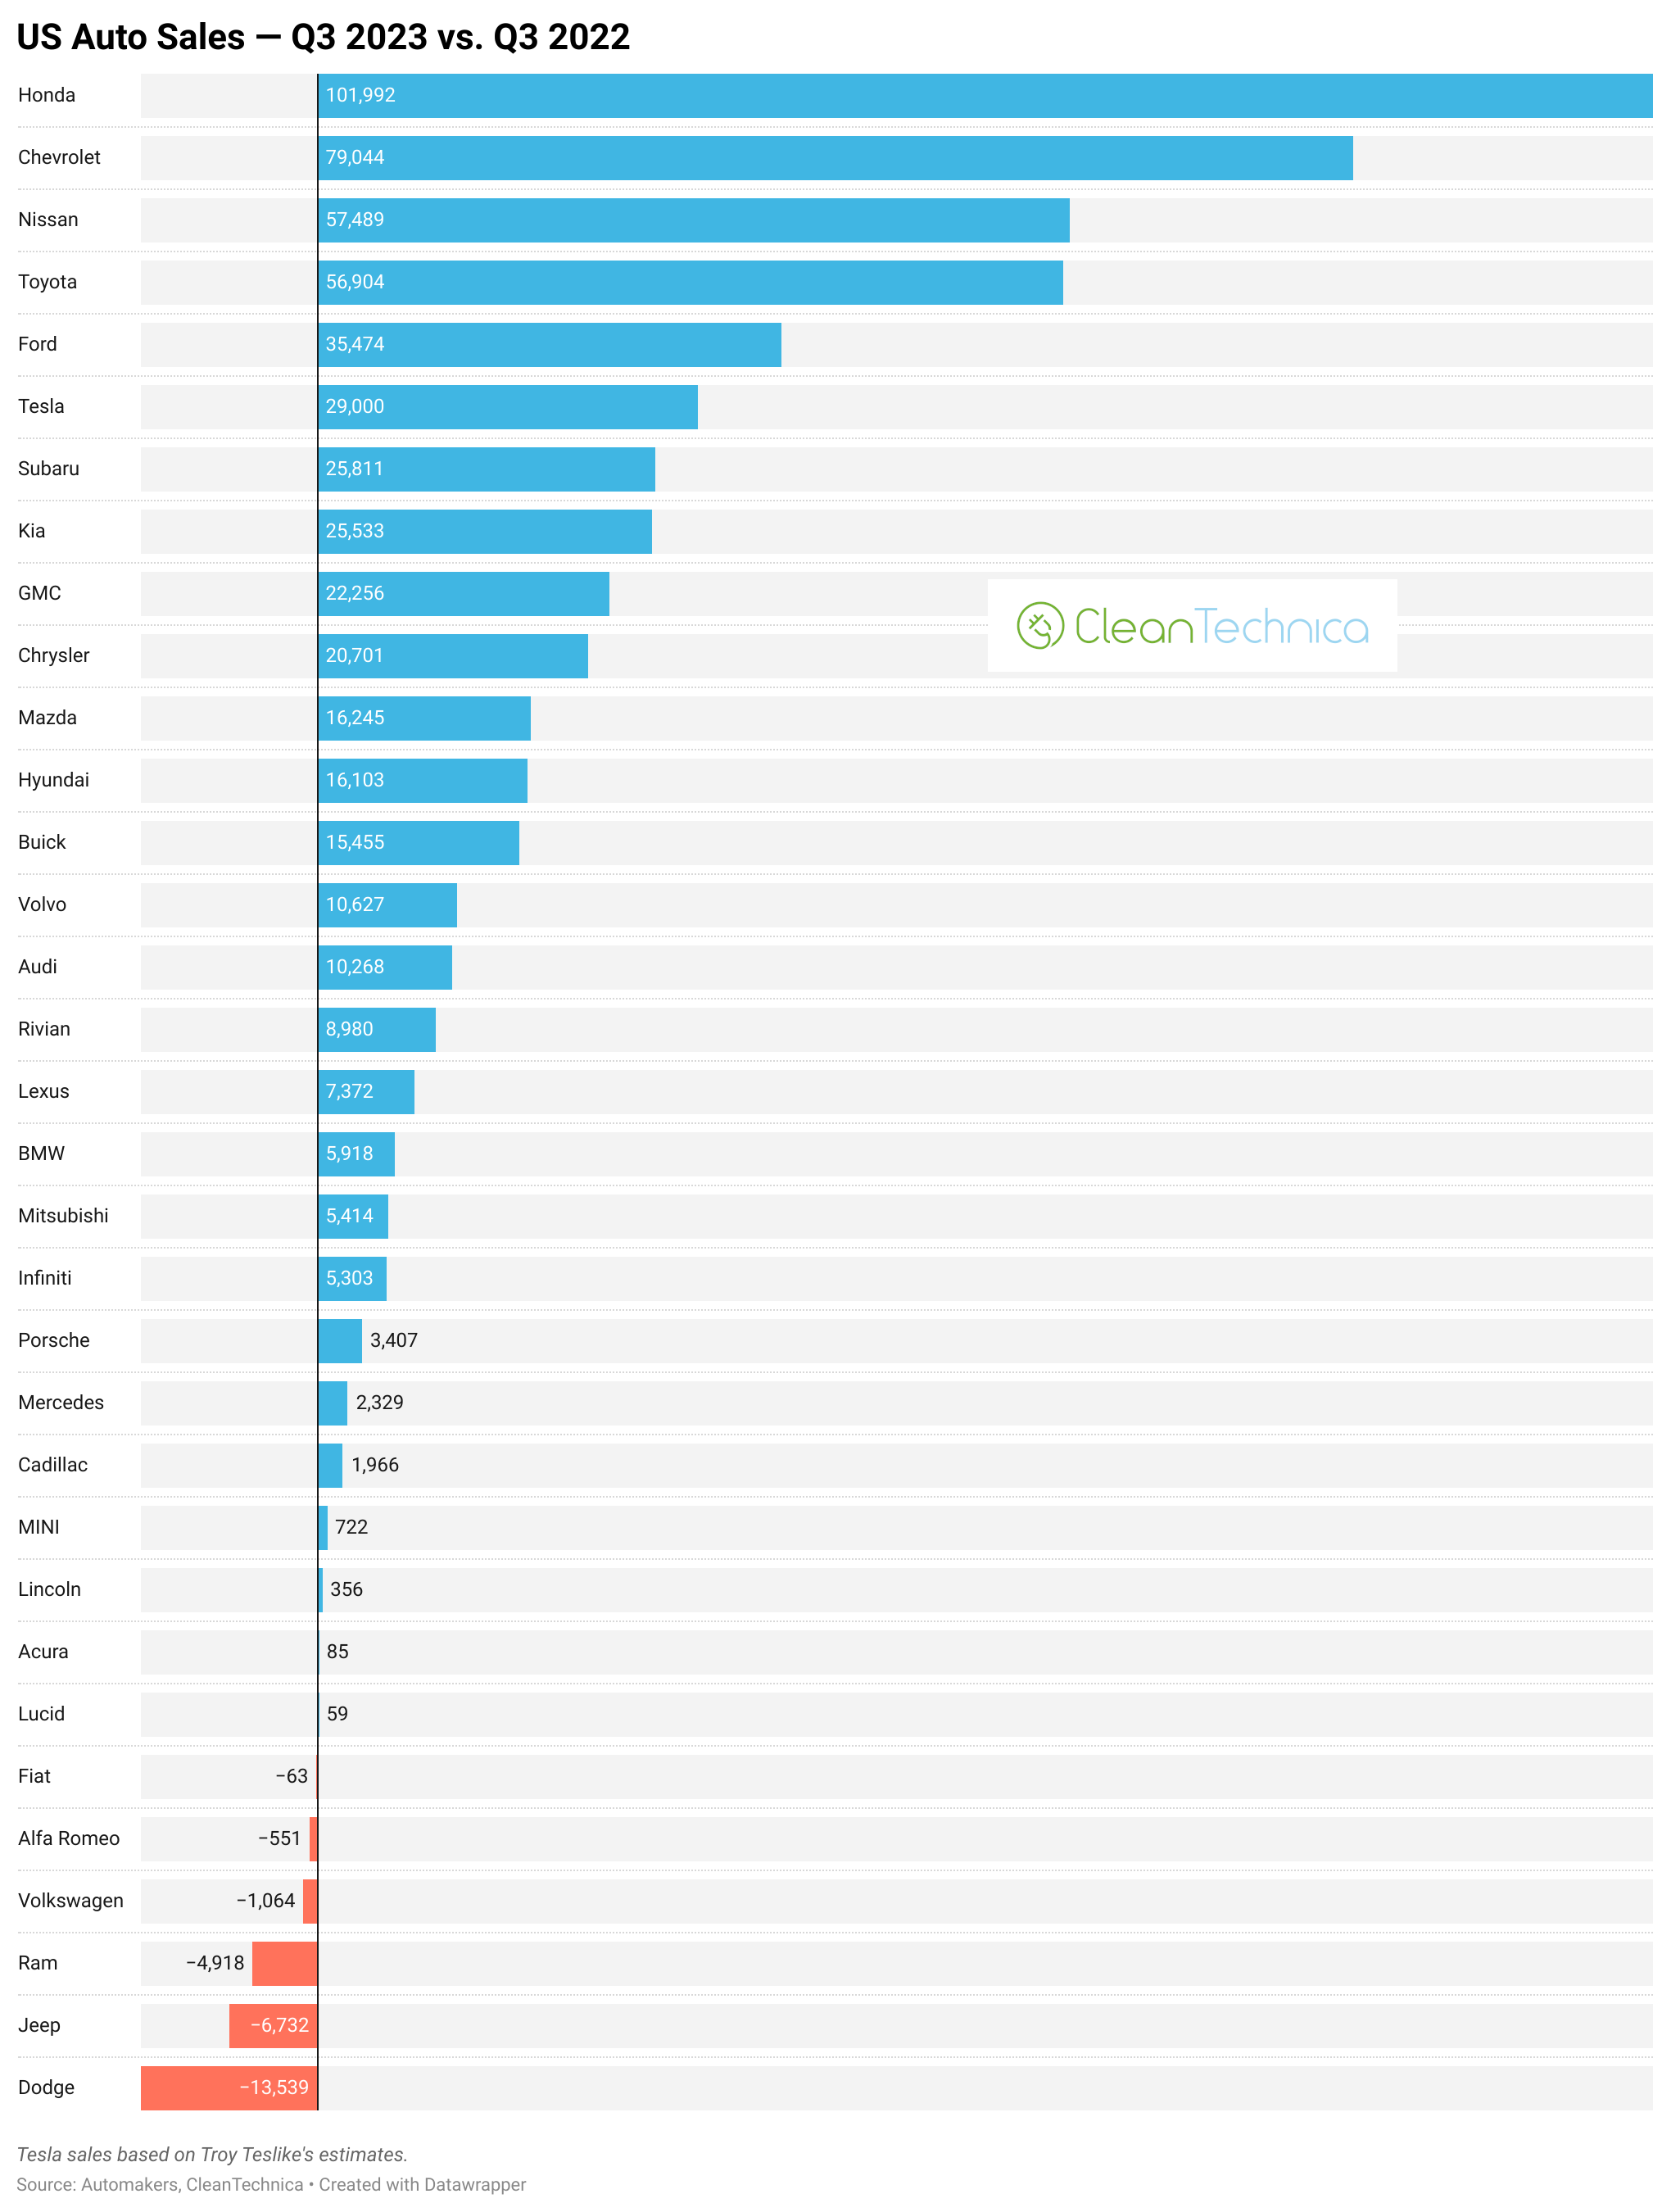
In volume terms, Honda, Chevrolet, Nissan, Toyota, and Ford were all up by more than Tesla, but Tesla did take 6th place with an estimated 29,000 more sales in the 3rd quarter of 2023 compared to the 3rd quarter of 2022. These are some of the brands that have lost the most sales compared to 2019, so it’s interesting that they are having a bigger and perhaps delayed bounceback in 2023 compared to other brands.
Last but not least, let’s explore the overall brand sales ranking in the 3rd quarter.
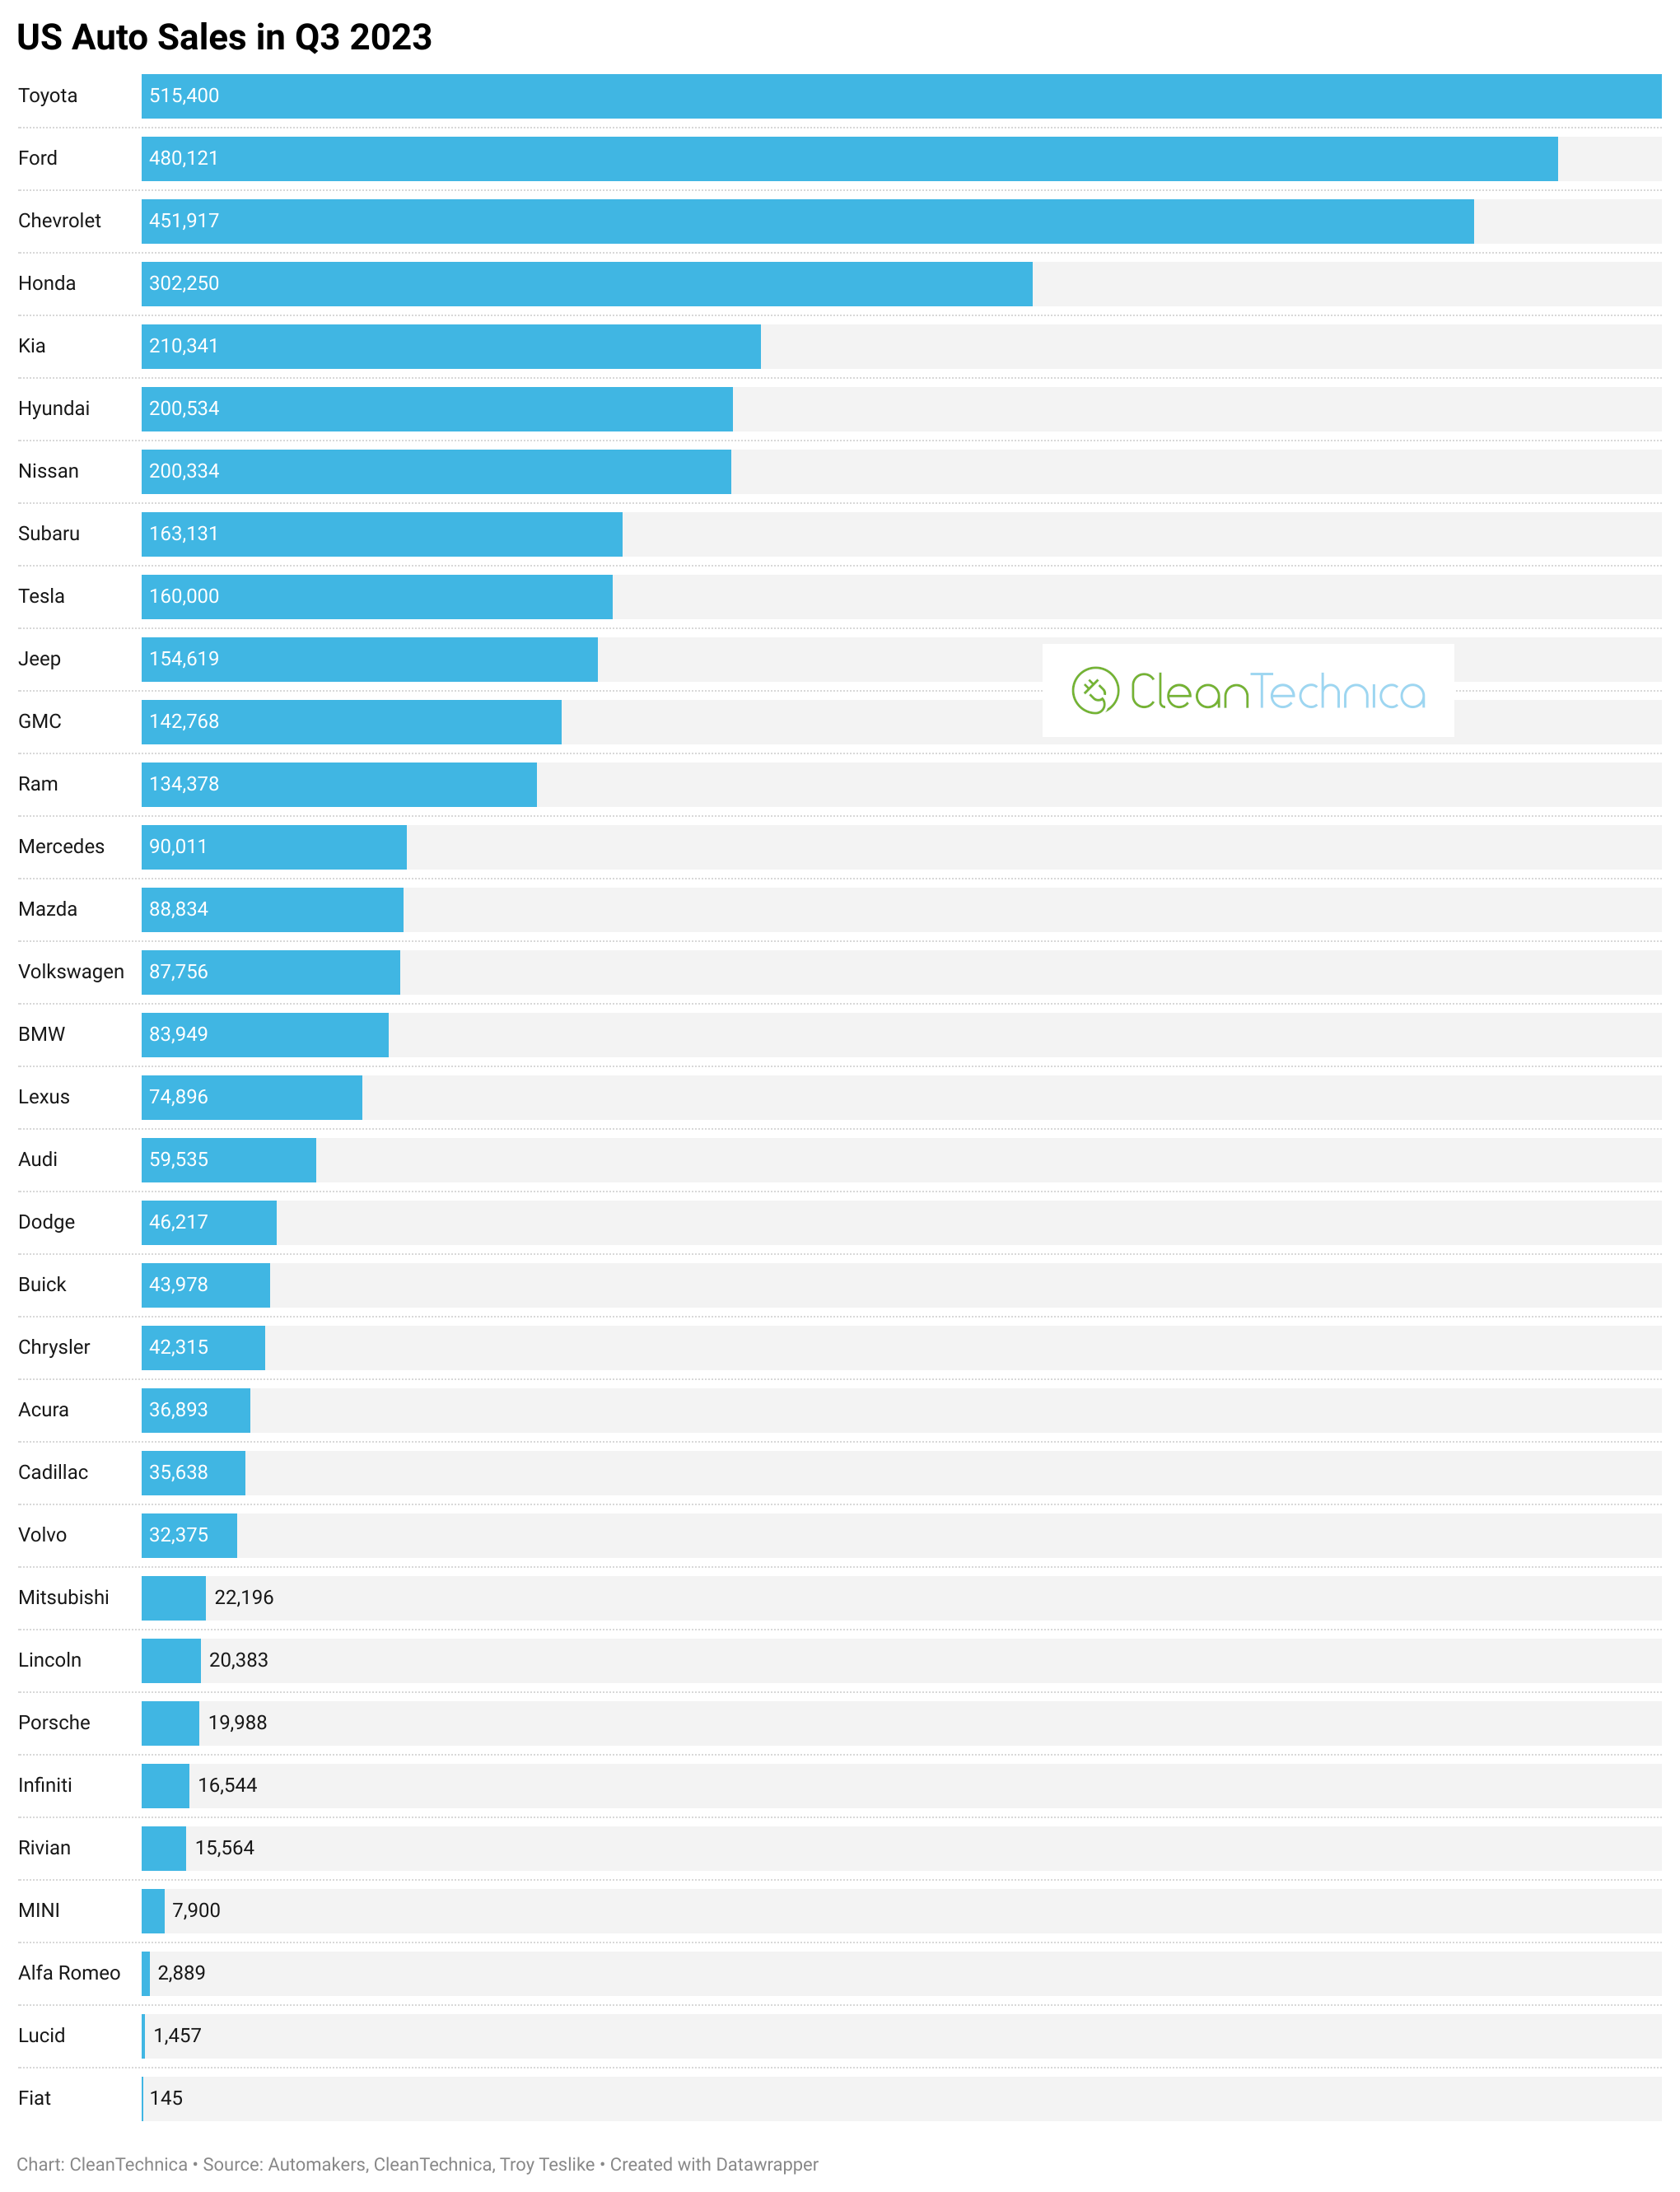
Tesla ended the quarter in 9th — just barely below 8th placed Subaru, and given that the Tesla numbers are an estimate (a highly informed estimate, but an estimate nonetheless), it’s possible Tesla actually slipped into 8th place in Q3. It’s also possible Tesla was in 10th place, below Jeep. Though, it’s safe to say Tesla was in the top 10, and given that Tesla typically has a very strong 4th quarter and consumers buying Tesla vehicles will be losing some US tax credits in 2024, I’d say it’s even possible that the brand reach the top 5 in the last quarter of the year. We shall see.
Any other thoughts on these US auto industry stats, charts, and trends.
Below, you can explore an interactive version of the big green chart for more fun. It’s not very useful or easy to play with on a smartphone, but it’s a lot of fun on a desktop or laptop computer. Enjoy!
Have a tip for CleanTechnica? Want to advertise? Want to suggest a guest for our CleanTech Talk podcast? Contact us here.
Our Latest EVObsession Video
[embedded content]
I don’t like paywalls. You don’t like paywalls. Who likes paywalls? Here at CleanTechnica, we implemented a limited paywall for a while, but it always felt wrong — and it was always tough to decide what we should put behind there. In theory, your most exclusive and best content goes behind a paywall. But then fewer people read it!! So, we’ve decided to completely nix paywalls here at CleanTechnica. But…
Thank you!
Advertisement
CleanTechnica uses affiliate links. See our policy here.
- SEO Powered Content & PR Distribution. Get Amplified Today.
- PlatoData.Network Vertical Generative Ai. Empower Yourself. Access Here.
- PlatoAiStream. Web3 Intelligence. Knowledge Amplified. Access Here.
- PlatoESG. Carbon, CleanTech, Energy, Environment, Solar, Waste Management. Access Here.
- PlatoHealth. Biotech and Clinical Trials Intelligence. Access Here.
- Source: https://cleantechnica.com/2023/12/17/us-auto-sales-down-8-in-q3-2023-vs-q3-2019/
- :has
- :is
- :not
- $UP
- 000
- 10
- 10th
- 11
- 12
- 15%
- 2%
- 2019
- 2020
- 2021
- 2022
- 2023
- 2024
- 29
- 36
- 3rd
- 4th
- 50
- 6th
- 7
- 8
- 8th
- 9
- 9th
- a
- above
- actually
- Advertise
- Affiliate
- again
- All
- also
- always
- an
- and
- Another
- anywhere
- approximately
- ARE
- AS
- At
- audi
- auto
- away
- back
- BE
- been
- behind
- below
- BEST
- Big
- bigger
- Bit
- BMW
- both
- brand
- brands
- but
- Buying
- by
- Cadillac
- CAN
- chain
- challenges
- Changes
- Chart
- Charts
- Chevrolet
- chip
- chrysler
- cleantech
- Cleantech Talk
- Close
- Companies
- company
- compared
- comparing
- comparison
- completely
- computer
- conditions
- Consumers
- content
- continue
- continues
- Couple
- course
- Credits
- curious
- Days
- decide
- decided
- Delayed
- desktop
- DID
- do
- Dodge
- don
- down
- Drop
- Drops
- easy
- Economic
- Economic Conditions
- Electric
- electric vehicle
- embedded
- ended
- estimate
- estimated
- EV
- Even
- exciting
- Exclusive
- explore
- faster
- felt
- fewer
- Fiat
- For
- Ford
- from
- fun
- get
- given
- Globally
- Goes
- going
- Green
- Grow
- Growth
- Guest
- Half
- Have
- having
- help
- here
- High
- higher
- highly
- How
- However
- HTTPS
- Hyundai
- if
- implemented
- in
- industry
- informed
- interactive
- interest
- Interest Rates
- interesting
- into
- IT
- ITS
- jeep
- jump
- just
- Keep
- Kia
- laptop
- Last
- Last Year
- latest
- least
- Legacy
- levels
- lexus
- like
- likes
- Limited
- links
- Look
- Losers
- losing
- lost
- Lot
- lucid
- max-width
- Media
- million
- models
- more
- most
- Need
- New
- news
- Nissan
- note
- now
- numbers
- of
- on
- only
- or
- Other
- Others
- otherwise
- our
- over
- overall
- past
- Peak
- People
- percentage
- perhaps
- period
- Place
- placed
- plato
- Plato Data Intelligence
- PlatoData
- Play
- player
- podcast
- policy
- Porsche
- possible
- post-pandemic
- pre-COVID
- publish
- purchasing
- put
- Q3
- Q3 2021
- q3 2022
- Quarter
- question
- quite
- Ranking
- Rates
- reach
- Read
- Reader
- recent
- relative
- rivian
- safe
- sales
- say
- scroll
- see
- several
- shifted
- should
- Shows
- significantly
- since
- smartphone
- So
- some
- stats
- Still
- Stories
- strong
- such
- suggest
- supply
- supply chain
- Supply Chain Challenges
- support
- surpassing
- T
- Take
- Talk
- targeting
- tax
- team
- terms
- Tesla
- than
- that
- The
- then
- theory
- There.
- These
- they
- though?
- Through
- tip
- to
- top
- Top 10
- top 5
- topped
- tough
- toyota
- Trends
- typically
- units
- Updates
- us
- uses
- Ve
- vehicle
- Vehicles
- version
- very
- Video
- volkswagen
- volume
- volvo
- vs
- want
- was
- we
- were
- What
- while
- WHO
- whole
- will
- with
- write
- Wrong
- year
- years
- you
- Your
- youtube
- zephyrnet
- zero