Earn Your First Bitcoin Sign up and get $12 Bonus Referral bonus up to $3,000
- Tron price started a fresh increase from the $0.0670 level against the US Dollar.
- TRX price is now trading near $0.0692 and the 55 simple moving average (4 hours).
- There is a major bearish trend line forming with resistance near $0.0694 on the 4-hours chart (data feed via Kraken).
- The pair could continue to move up if it breaks the $0.070 resistance zone.
TRON price started a fresh increase above $0.0685 against the US Dollar, similar to Bitcoin. TRX’s price could rise further if it clears the $0.070 resistance.
Tron Price Analysis
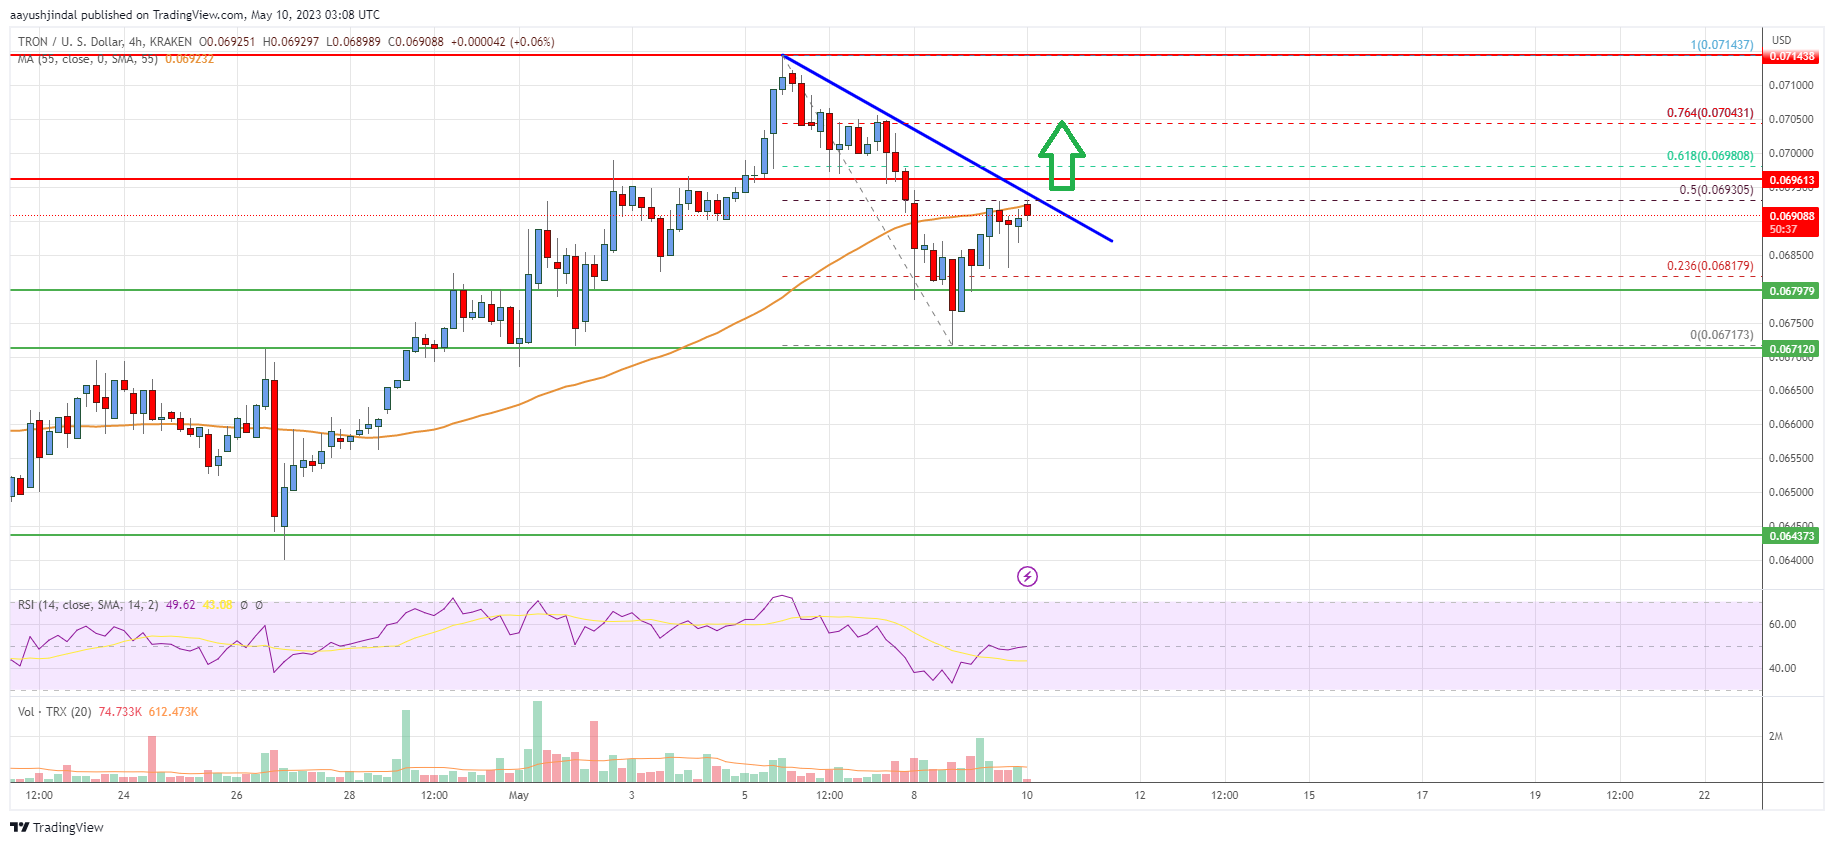
After a downside correction, Tron price found support near the $0.0672 zone against the US Dollar. TRX’s price formed a base and recently started a fresh increase from the $0.0671 low.
There was a break above the $0.0675 and $0.0680 levels. The price climbed above the 23.6% Fib retracement level of the downward move from the $0.0714 swing high to the $0.0671 low. TRX is now trading near $0.0692 and the 55 simple moving average (4 hours).
On the upside, TRX is facing resistance near the $0.0694 level. There is also a major bearish trend line forming with resistance near $0.0694 on the 4-hours chart.
The trend line is close to the 50% Fib retracement level of the downward move from the $0.0714 swing high to the $0.0671 low. The next major resistance is near the $0.070 level. A close above $0.070 could send the price toward the $0.0720 resistance zone.
Any more gains might send TRX price toward $0.075, above which the price could even rise toward $0.078. On the downside, initial support is near the $0.0680 level. The next major support is now forming near $0.0670 or the recent low.
If there is a downside break below the $0.0670 support, the price might revisit the $0.0644 support. Any more losses might call for a move toward the $0.0620 zone in the near term.
Tron (TRX) Price
The chart indicates that TRX’s price is now trading near $0.0693 and the 55 simple moving average (4 hours). Overall, the price could continue to move up if it breaks the $0.070 resistance zone.
Technical Indicators
4 hours MACD – The MACD for TRX/USD is now gaining momentum in the bullish zone.
4 hours RSI – The RSI for TRX/USD is above the 50 level.
Key Support Levels – $0.0680 and $0.0670.
Key Resistance Levels – $0.0694, $0.070, and $0.0720.
- SEO Powered Content & PR Distribution. Get Amplified Today.
- PlatoAiStream. Web3 Data Intelligence. Knowledge Amplified. Access Here.
- Minting the Future w Adryenn Ashley. Access Here.
- Buy and Sell Shares in PRE-IPO Companies with PREIPO®. Access Here.
- Source: https://www.livebitcoinnews.com/tron-trx-price-analysis-fresh-increase-to-0-072-seems-likely/
- :is
- $3
- $UP
- 23
- 28
- 50
- 7
- a
- above
- against
- also
- analysis
- and
- any
- average
- base
- bearish
- below
- Bitcoin
- Bonus
- Break
- breaks
- Bullish
- call
- Chart
- Climbed
- Close
- COM
- comments
- continue
- could
- data
- Dollar
- downside
- downward
- end
- Even
- facing
- First
- follow
- For
- formed
- found
- fresh
- fresh increase
- from
- further
- gaining
- Gains
- get
- High
- HOURS
- HTTPS
- if
- in
- Increase
- indicates
- initial
- internal
- IT
- Kraken
- Level
- levels
- likely
- Line
- logo
- losses
- Low
- MACD
- major
- might
- Momentum
- more
- move
- moving
- moving average
- Near
- next
- now
- of
- on
- or
- overall
- plato
- Plato Data Intelligence
- PlatoData
- Post
- price
- Price Analysis
- recent
- recently
- Referral
- Resistance
- retracement
- Rise
- rsi
- seems
- send
- sign
- similar
- Simple
- started
- support
- support levels
- Swing
- TAG
- that
- The
- There.
- to
- toward
- Trading
- TradingView
- Trend
- TRON
- TRON (TRX)
- TRX
- TRX Price
- TRX/USD
- Upside
- us
- US Dollar
- via
- was
- which
- with
- Your
- zephyrnet