
Online trading continues to attract many players and investors. However, the industry is still as technical as ever. To trade successfully, you need proper analysis and insights, whether it’s stocks, indices, futures, Forex, or Bitcoin. And that’s where a platform like TradingView comes in. More than 50 million traders and investors use TradingView. It’s a social platform with some of the world’s most powerful market analysis tools, giving traders the solution they need to make better decisions.
TradingView houses a stock screener that presents information about a vast number of tradable stocks. You get info on market cap, sector, earnings, dividends, and more. In addition, the platform provides real-time news on the happenings in various markets, sourcing happenings from Reuters, CNBC, Routers, and other top publishers. Of course, you can’t skip the watchlists, hotlists, charts, and indicators.
With all these, it’s understandable why more brokers choose to join the list of TradingViev supported brokers. However, behind the elegance of the stocks, charts, and indicators, is the platform crucial for trading analysis? That’s the discussion in this article.
An Overview of TradingView Charts
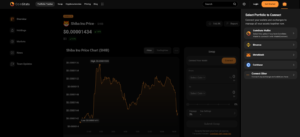
Charts are among the most used features by TradingView brokers, and they function for trading analysis in many ways. First, TradingView lets users annotate charts. You can do that using several drawing tools, including trend lines, pitchforks, and Fibonacci retracements. Even texts and shapes will work, and with this, you can easily highlight critical chart areas for your trading analysis.
Furthermore, it’s noteworthy that TradingView supports various chart types. You can view candlesticks, line graphs, and area charts, to name a few. Each one has its advantage when it comes to analysis. For instance, candlesticks make it easy to follow closing and opening prices, while line charts reveal trends.
Thanks to TradingView’s detailed charts, traders can easily identify trends, patterns, and signals for better predictions. Consider the line charts, for example. As a trader, you can spot trend directions to invest your money for better returns. In addition, you can read patterns from charts to know when a trend might change. Likewise, charts uncover signals based on different price actions like pullbacks, breakouts, and resistance levels. All these are valuable for trading analysis.
TradingView Analysis Tools
When talking about trading analysis tools, the discussion centers on indicators. TradingView supports an array of them, which you can apply to charts, including moving averages, volume, and oscillators. The best part is that there are hundreds of custom indicators you can use created by professional traders. If you can use the Pine Script, you can build your indicators from scratch.
Interestingly, TradingView lets you add up to 25 indicators on charts and graphs. Also, you can adjust how they show, especially in terms of colors and styles. The popular indicators you’ll find on TradingView include Relative Strength Index (RSI), Moving Average Convergence Divergence (MACD), and Bollinger Bands.
These indicators contribute greatly to trading analysis. In particular, they make understanding market conditions a lot easier. Consider the MACD indicator, which uncovers the strength and direction of trends. Then, you can employ RSI to analyze oversold and overbought conditions, and this gives you priceless info on market participation.
An important aspect of online trading is volatility. It’s crucial, especially when trading items like forex and cryptocurrency. As a result, it’s noteworthy that TradingView supports many volatility indicators. Bollinger Bands are a good example. Using them, you can spot low and high volatility periods, hence identifying potential contractions and breakouts.
Generating Trading Ideas
Analysis without execution is time-wasting. So, that TradingView goes ahead to help traders put their findings into action is commendable. Particularly, this stems from the social aspect of the platform. It’s like any other social media platform where users can like, share, follow, and comment. Likewise, you can publish your content for others to engage.
With this feature, it’s easy to get ideas to help better your trading strategies. TradingView is home to many expert brokers and traders, who you can follow and learn from their market analyses. You can then customize it based on your trading plan and execute it. As you develop your trading ideas, also share them with others. You can improve your strategy from the feedback you receive and even learn about new concepts.
Bottom Line
With the details so far, it’s evident that TradingView is, indeed, an elegant yet crucial helper when it comes to trading analysis. Powerful tools to create, customize, and share charts, indicators, and trading ideas are at your disposal as a user, and you get access to a large and active community of experts and trading enthusiasts.
Most people consider TradingView as simply a chatting platform, but that’s wrong. It’s more. It’s a social network for traders who want to improve their skills, knowledge, and performance. You can start using the platform at no cost by signing up for a free account!
- SEO Powered Content & PR Distribution. Get Amplified Today.
- PlatoData.Network Vertical Generative Ai. Empower Yourself. Access Here.
- PlatoAiStream. Web3 Intelligence. Knowledge Amplified. Access Here.
- PlatoESG. Automotive / EVs, Carbon, CleanTech, Energy, Environment, Solar, Waste Management. Access Here.
- BlockOffsets. Modernizing Environmental Offset Ownership. Access Here.
- Source: https://coinstats.app/blog/tradingview-review/
- :has
- :is
- :where
- $UP
- 25
- 50
- a
- About
- access
- Action
- actions
- active
- add
- addition
- ADvantage
- ahead
- All
- also
- among
- an
- analysis
- analyze
- and
- any
- Apply
- ARE
- AREA
- areas
- Array
- article
- AS
- aspect
- At
- attract
- average
- based
- behind
- BEST
- Better
- Bitcoin
- blockchain
- Blog
- Bollinger bands
- Box
- breakouts
- brokers
- build
- but
- by
- CAN
- cap
- categories
- Centers
- change
- Chart
- Charts
- chatting
- Choose
- closing
- CNBC
- comes
- commendable
- comment
- community
- concepts
- conditions
- Consider
- content
- continues
- contribute
- Convergence
- Cost
- course
- create
- created
- critical
- crucial
- cryptocurrency
- custom
- customize
- decisions
- detailed
- details
- develop
- different
- direction
- directions
- discussion
- Divergence
- dividends
- do
- drawing
- each
- Earnings
- easier
- easily
- easy
- engage
- enthusiasts
- especially
- Ether (ETH)
- Even
- EVER
- evident
- example
- execute
- execution
- expert
- experts
- far
- Feature
- Features
- feedback
- few
- Fibonacci
- fidelity
- Find
- findings
- First
- follow
- For
- forex
- Free
- from
- function
- Futures
- get
- gives
- Giving
- Goes
- good
- graphs
- greatly
- help
- hence
- High
- Highlight
- Home
- houses
- How
- However
- HTTPS
- Hundreds
- ideas
- identify
- identifying
- if
- important
- important aspect
- improve
- in
- include
- Including
- Indicator
- Indicators
- Indices
- industry
- info
- information
- insights
- instance
- into
- Invest
- Investors
- IT
- items
- ITS
- join
- jpg
- Know
- knowledge
- large
- LEARN
- Lets
- levels
- like
- Line
- lines
- Lot
- Low
- MACD
- make
- many
- Market
- Market Analysis
- Market Cap
- market conditions
- Markets
- Media
- might
- million
- money
- more
- most
- moving
- moving average
- moving averages
- name
- Need
- network
- New
- news
- no
- noteworthy
- number
- of
- on
- ONE
- online
- opening
- or
- Other
- Others
- overview
- part
- participation
- particular
- particularly
- patterns
- People
- performance
- periods
- plan
- platform
- plato
- Plato Data Intelligence
- PlatoData
- players
- Popular
- potential
- powerful
- Predictions
- presents
- price
- priceless
- Prices
- professional
- proper
- provides
- publish
- publishers
- put
- Read
- real-time
- receive
- Resistance
- result
- returns
- Reuters
- reveal
- review
- rsi
- scratch
- sector
- several
- shapes
- Share
- show
- signals
- signing
- simply
- skills
- So
- so Far
- Social
- social media
- social network
- social platform
- solution
- some
- Sourcing
- Spot
- start
- stems
- Still
- stock
- Stocks
- strategies
- Strategy
- strength
- styles
- Successfully
- Supported
- Supports
- talking
- Technical
- terms
- than
- that
- The
- their
- Them
- then
- There.
- These
- they
- this
- to
- tools
- top
- trade
- trader
- Traders
- Trading
- Trading Strategies
- TradingView
- Trend
- Trends
- types
- uncover
- understandable
- understanding
- use
- used
- User
- users
- using
- Valuable
- various
- Vast
- View
- Volatility
- volume
- want
- ways
- when
- whether
- which
- while
- WHO
- why
- will
- with
- without
- Work
- world’s
- Wrong
- yet
- you
- Your
- zephyrnet

![How to Stake MATIC [The Ultimate Guide 2023]](https://platoaistream.com/wp-content/uploads/2023/04/how-to-stake-matic-the-ultimate-guide-2023-300x225.webp)
![The Ultimate BTSE Review [For 2023] | CoinStats Blog](https://platoaistream.com/wp-content/uploads/2023/07/the-ultimate-btse-review-for-2023-coinstats-blog-300x131.webp)


![PancakeSwap Review 2023 [Fees, Pros, Cons, and Features]](https://platoaistream.com/wp-content/uploads/2023/04/pancakeswap-review-2023-fees-pros-cons-and-features-300x189.webp)