- Stellar lumen price is showing bearish signs below the $0.090 resistance zone against the US Dollar.
- XLM price is now trading below $0.090 and the 55 simple moving average (4-hours).
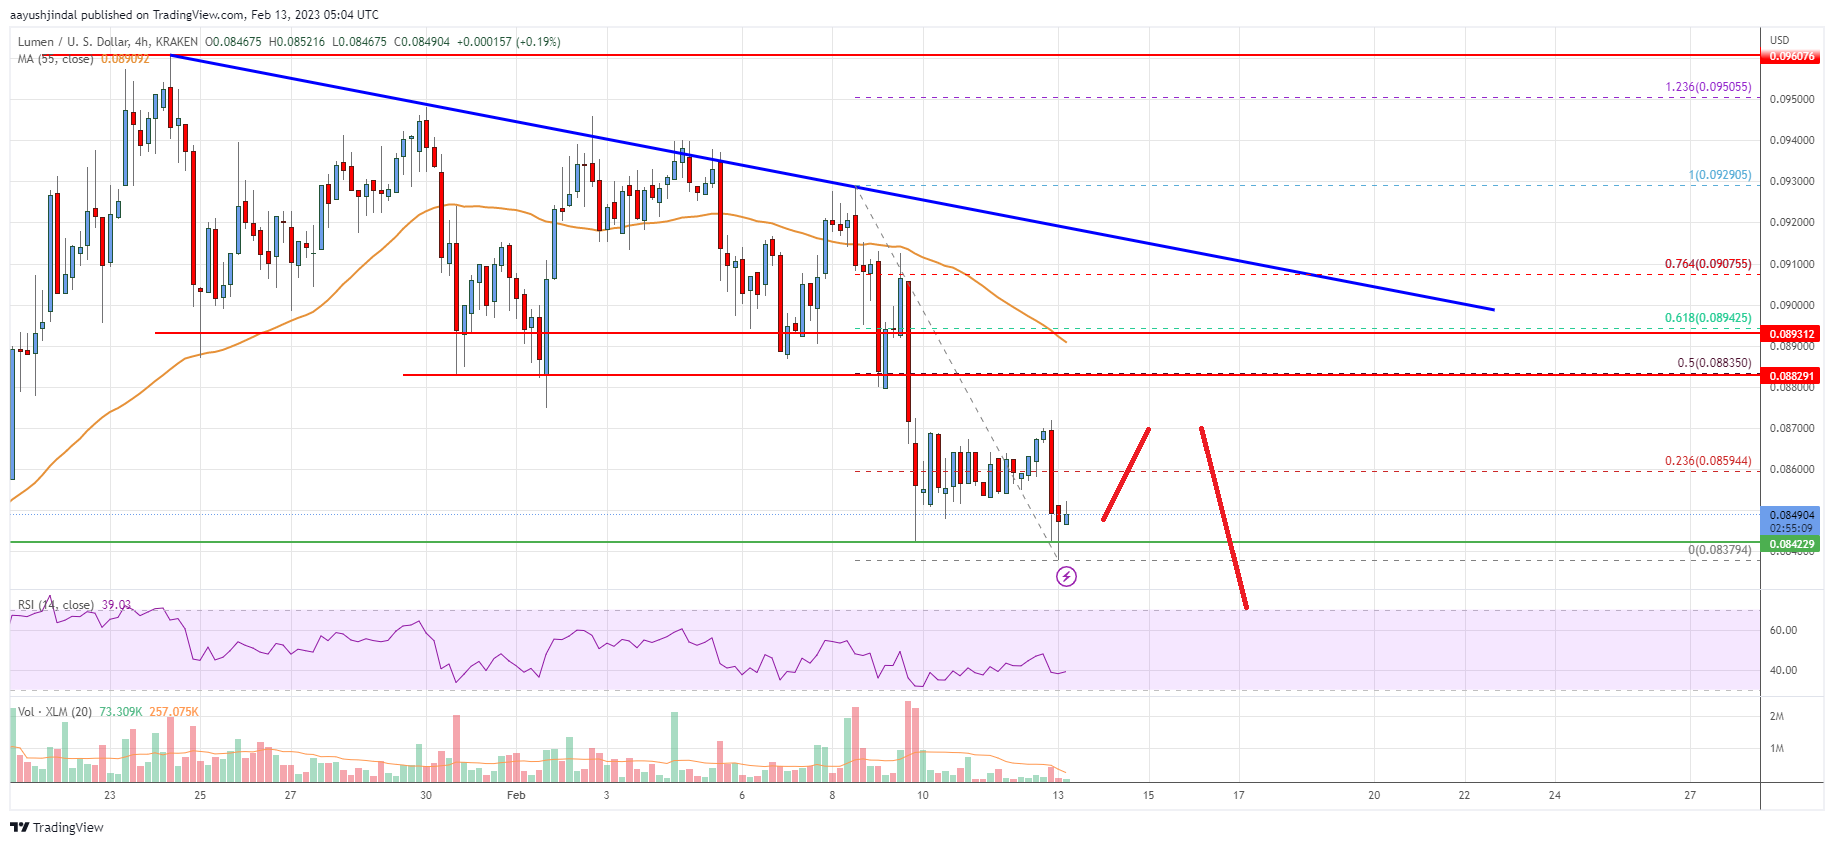
- There is a key bearish trend line forming with resistance near $0.090 on the 4-hours chart (data feed via Kraken).
- The pair could start another decline if there is a clear move below the $0.084 support.
Stellar lumen price is trading below $0.090 against the US Dollar, similar to bitcoin. XLM price must stay above the $0.084 support to avoid more losses.
Stellar Lumen Price Analysis (XLM to USD)
After a failed attempt near the $0.095 zone, stellar lumen price started a fresh decline against the US Dollar. The XLM/USD pair traded below the $0.0900 support to move into a bearish zone.
There was a move below the $0.0880 and $0.0865 levels. The price even settled below the $0.090 level and the 55 simple moving average (4-hours). A low was formed near $0.0837 and the price is now consolidating losses. The bears seem to be active below the $0.0880 level.
On the upside, the price is facing resistance near the $0.0860 level. It is also near the 23.6% Fib retracement level of the recent decline from the $0.0929 swing high to $0.0837 low.
The next major resistance is near the $0.0880 zone. It is close to the 50% Fib retracement level of the recent decline from the $0.0929 swing high to $0.0837 low. The main resistance sits near the $0.090 level. There is also a key bearish trend line forming with resistance near $0.090 on the 4-hours chart.
A clear upside break above the trend line might send the price towards $0.0950. Any more gains could lead the price towards the $0.0980 level or even $0.1020.
An initial support on the downside is near the $0.0840 level. The main support is near the $0.082 zone. Any more losses could lead the price towards the $0.080 level in the near term, below which the price might even retest $0.0765.
Stellar Lumen (XLM) Price
The chart indicates that XLM price is now trading below $0.090 and the 55 simple moving average (4-hours). Overall, the price could start a major decline if there is a clear move below the $0.084 support.
Technical Indicators
4 hours MACD – The MACD for XLM/USD is gaining momentum in the bearish zone.
4 hours RSI – The RSI for XLM/USD is now below the 50 level.
Key Support Levels – $0.0840 and $0.0820.
Key Resistance Levels – $0.0860, $0.0880 and $0.090.
- SEO Powered Content & PR Distribution. Get Amplified Today.
- Platoblockchain. Web3 Metaverse Intelligence. Knowledge Amplified. Access Here.
- Source: https://www.livebitcoinnews.com/stellar-lumen-xlm-price-takes-hit-risk-of-more-downsides/
- a
- above
- active
- against
- analysis
- and
- Another
- average
- bearish
- bearish signs
- Bears
- below
- Break
- Chart
- clear
- Close
- comments
- consolidating
- could
- data
- Decline
- Dollar
- downside
- downsides
- Even
- facing
- Failed
- follow
- formed
- fresh
- from
- gaining
- Gains
- High
- Hit
- HOURS
- HTTPS
- in
- indicates
- initial
- internal
- IT
- Key
- Kraken
- lead
- Level
- levels
- Line
- losses
- Low
- Lumen
- MACD
- Main
- major
- might
- Momentum
- more
- move
- moving
- moving average
- Near
- next
- overall
- plato
- Plato Data Intelligence
- PlatoData
- Post
- price
- Price Analysis
- recent
- Resistance
- retracement
- Risk
- rsi
- Settled
- Signs
- similar
- Simple
- start
- started
- stay
- Stellar
- Stellar Lumen
- support
- support levels
- TAG
- takes
- The
- to
- towards
- traded
- Trading
- TradingView
- Trend
- Upside
- us
- US Dollar
- USD
- via
- which
- XLM
- xlm price
- XLM/USD
- zephyrnet