- Stellar lumen price started a fresh decline from the $0.1300 resistance against the US Dollar.
- XLM price is now trading below $0.1120 and the 55 simple moving average (4-hours).
- There is a key bearish trend line with resistance near $0.1120 on the 4-hours chart (data feed via Kraken).
- The pair could decline sharply if there is a clear break below the $0.1000 support zone.
Stellar lumen price is trading below $0.1200 against the US Dollar, similar to bitcoin. XLM price must stay above the $0.1000 support to avoid a downside break.
Stellar Lumen Price Analysis (XLM to USD)
After forming a base above the $0.1050 level, stellar lumen price started a fresh increase against the US Dollar. The XLM/USD pair broke the $0.1120 resistance zone.
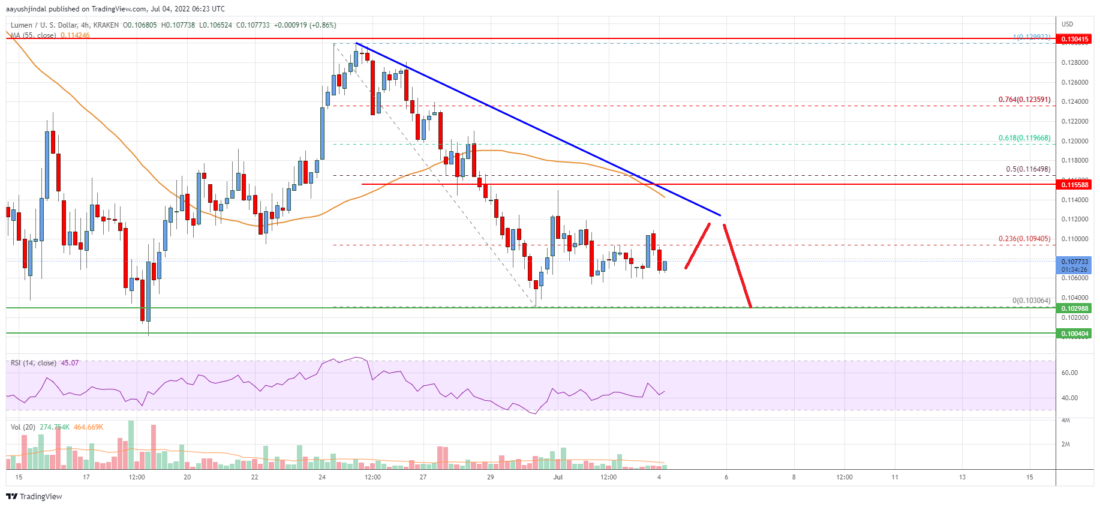
The price even broke the $0.1200 resistance and the 55 simple moving average (4-hours). However, the bears remained active near the $0.1300 zone. A high was formed near the $0.1299 level and the price started a fresh decline.
There was a clear move below the $0.1120 support. The price traded as low as $0.1030 and is currently consolidating losses. On the upside, the price is facing resistance near the $0.1100 zone. It is near the 23.6% Fib retracement level of the recent decline from the $0.1299 swing high to $0.1030 low.
The next major resistance is near the $0.1150 level. There is also a key bearish trend line with resistance near $0.1120 on the 4-hours chart. The trend line is close to the 50% Fib retracement level of the recent decline from the $0.1299 swing high to $0.1030 low.
A clear move above the $0.1150 level might send the price towards the $0.1250 level. Any more gains could lead the price towards the $0.1300 level.
An initial support on the downside is near the $0.1030 level. The main support is near the $0.1000 zone. Any more losses could lead the price towards the $0.0880 level in the near term, below which the price might even test $0.0750.

Stellar Lumen (XLM) Price
The chart indicates that XLM price is now trading below $0.1150 and the 55 simple moving average (4-hours). Overall, the price could decline sharply if there is a clear break below the $0.1000 support zone.
Technical Indicators
4 hours MACD – The MACD for XLM/USD is losing momentum in the bullish zone.
4 hours RSI – The RSI for XLM/USD is now below the 50 level.
Key Support Levels – $0.1030 and $0.1000.
Key Resistance Levels – $0.1100, $0.1120 and $0.1150.
The post Stellar Lumen (XLM) Price Could Dive If It Breaks This Support appeared first on Live Bitcoin News.
- a
- active
- against
- analysis
- appeared
- average
- bearish
- Bears
- below
- Bitcoin
- breaks
- Bullish
- could
- Currently
- data
- Dollar
- facing
- First
- fresh
- from
- High
- However
- HTTPS
- Increase
- IT
- Key
- Kraken
- lead
- Level
- levels
- Line
- losses
- Lumen
- major
- might
- Momentum
- more
- move
- moving
- Near
- next
- overall
- price
- Price Analysis
- recent
- remained
- similar
- Simple
- started
- stay
- Stellar
- support
- test
- The
- towards
- Trading
- us
- US Dollar
- USD
- XLM