CryptoSlam, the blockchain data aggregator states that Solana SOL currently ranks as the fourth most popular blockchain by NFT sales volume. In the first position is Ethereum, followed by Ronin, and WAX-Worldwide Asset eXchange.
Total NFT sales on the Solana network are over 498 million USD at press time after hitting a daily volume of roughly 37.7 million USD on 31 August.
It is also worth mentioning that Solana is now ranked the fifth cryptocurrency by market cap, ahead of Cardano’s ADA.
At a market Cap above 73Billion USD at the time of writing, Solana continues to be a promising investment since it has so far recorded astronomical gains of about 7000% since January this year for holders.
Another exciting news for the Solana ecosystem is the partnership between Solana Ventures, FTX, and LightSpeed Venture Partners to co-invest 100 million USD into crypto gaming projects.
Let’s analyze the SOLUSDT price charts for insights into the technical levels and chart patterns driving the SOL price.
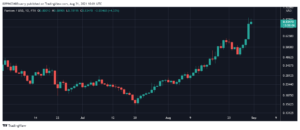
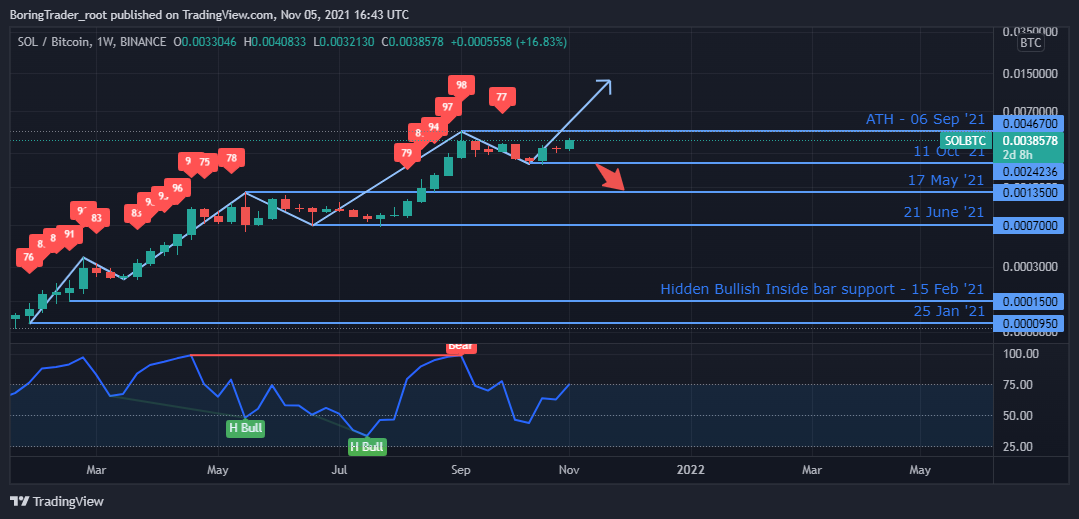
Solana SOLBTC Weekly Chart Analysis

The SOL cryptocurrency continues to see growing demand vs. BTC with the above chart showing higher RSI values above level-75 and currently threatening a breakout above the 06 September ’21 high.
We should expect a bearish divergence signal if the SOLBTC sets a new ATH with a closing weekly candlestick above the current ATH, while the RSI does not exceed level-98, which should restore demand for BTC.
Solana SOL Weekly Chart Analysis
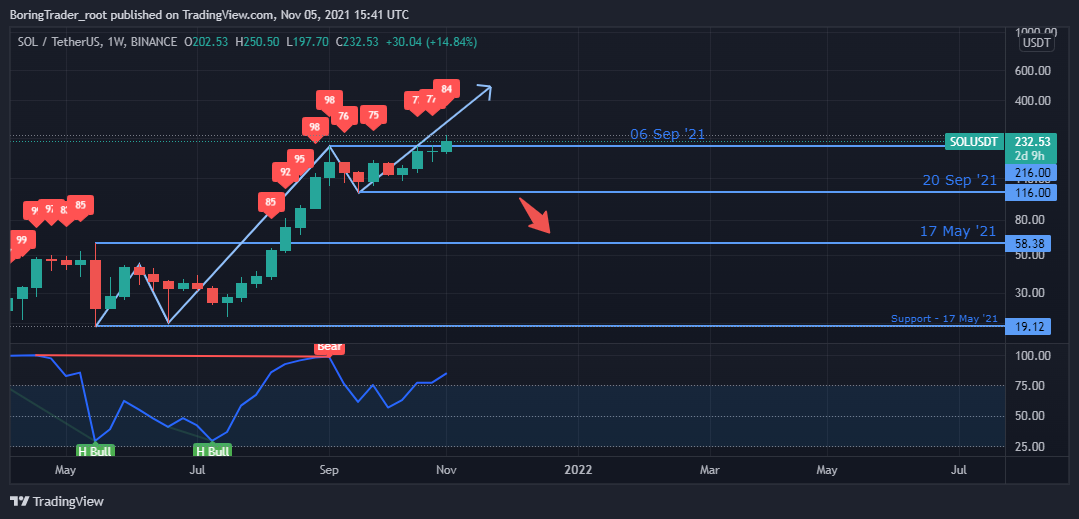
The SOLUSDT and SOLBTC weekly charts form a similar structure. Bullish momentum already drives the SOL price above the previous ATH, therefore putting the SOLUSDT in a bearish divergence structure.
The bearish divergence signal on the weekly chart is a warning signal that we should be risk-averse at the current level the SOL price is trading at. By locking up some gains and using trailing stop orders, we can lock in some profits and without fear, trade any further surge in the price of the SOLUSDT.
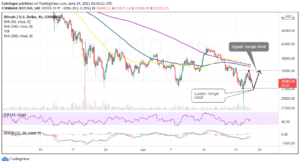
Solana SOL Daily Chart Analysis
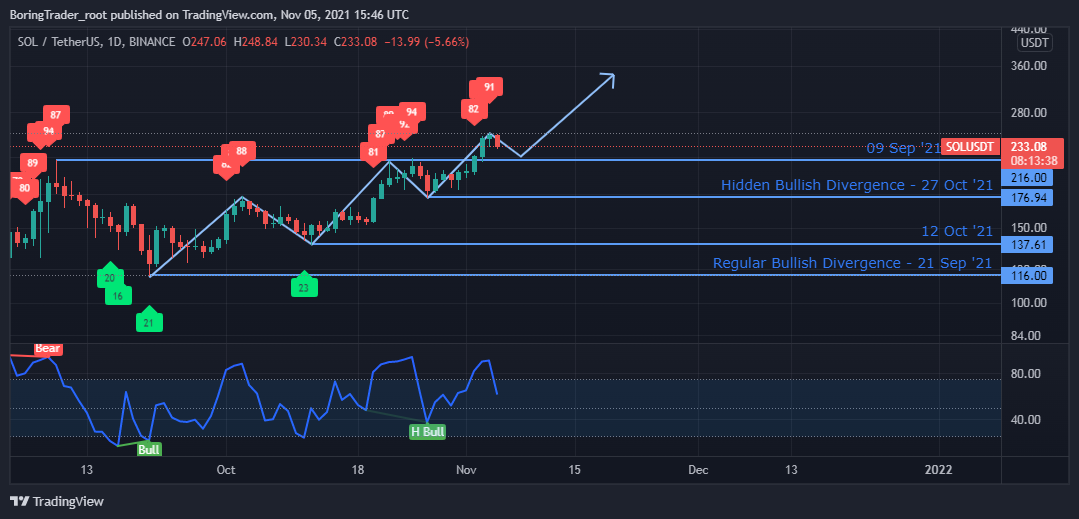
From the daily time frame, the SOLUSDT signaled a hidden bullish divergence which saw the price of the crypto asset shooting past the $216.00 resistance.
A recent bearish divergence sets a resistance level at $250.50 for which we expect a price correction or slowing of the uptrend from the current price peak.
Let’s move down to the 4HR time frame for clues into buying the dips.
Solana SOL 4HR Chart Analysis
The 4HR time frame also signaled a hidden bullish divergence signaling a further hike in the SOL price, to later get opposed by a counter regular bearish divergence of 04 November 20:00.
A price breach above the $250.50 resistance should lead to a prolonged uptrend.
Solana SOL Intraday Levels
- Spot rate: 247.00
- Mid–Term Trend [H4]: Bullish
- Volatility: High
- Support: $176.94, $185.31, and $221.12
- Resistance: $250.5
Source: https://coingape.com/solana-sol-price-analysis-solusdt-trades-expanding-channel/
- 100
- 7
- ADA
- analysis
- asset
- AUGUST
- bearish
- blockchain
- breach
- breakout
- BTC
- Bullish
- Buying
- Charts
- content
- continues
- crypto
- crypto asset
- cryptocurrencies
- cryptocurrency
- Current
- data
- Demand
- driving
- ecosystem
- ethereum
- exchange
- expanding
- financial
- First
- form
- FTX
- gaming
- Growing
- High
- hold
- HTTPS
- insights
- investing
- investment
- IT
- lead
- Level
- lightspeed
- Market
- Market Cap
- market research
- million
- Momentum
- Most Popular
- move
- network
- news
- NFT
- Opinion
- orders
- partners
- Partnership
- Popular
- press
- price
- Price Analysis
- projects
- research
- sales
- Share
- Slowing
- So
- Solana
- States
- surge
- Technical
- time
- trade
- trades
- Trading
- USD
- venture
- Ventures
- volume
- weekly
- worth
- writing
- year