- Solana price started a strong increase above the $92.00 resistance against the US Dollar.
- The price is now trading above $100 and the 55 simple moving average (4 hours).
- There is a connecting bullish trend line forming with support near $100 on the 4-hour chart of the SOL/USD pair (data feed from Coinbase).
- The pair must clear $105 and $112 to continue higher in the near term.
Solana price is trading in a positive zone above $100 against the US Dollar, like Bitcoin. SOL could extend its rally toward the $120 resistance.
Solana (SOL) Price Analysis
SOL price remained in a bullish zone above the $80 and $82 support levels. The bulls were active near the $92 zone. A base was formed, and the price started a decent increase above the $98 level.
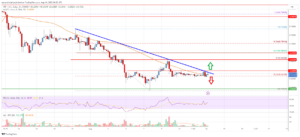
There was a push above the $100 level and the 55 simple moving average (4 hours). The pair even climbed above the $105 level. A high was formed near $106.45 and the price is now consolidating gains. It is trading near the 23.6% Fib retracement level of the upward move from the $78.14 swing low to the $106.45 high.
SOL is now trading above $100 and the 55 simple moving average (4 hours). There is also a connecting bullish trend line forming with support near $100 on the 4-hour chart of the SOL/USD pair.
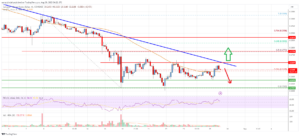
On the upside, an immediate resistance is near the $102.5 level. The next major resistance is near the $105 zone. Any more gains might send SOL price toward the $112 resistance zone, above which the price could accelerate higher. The next major resistance sits near the $120 level.
On the downside, initial support is near the $100 level and the trend line zone. A downside break below the $100 support level might push the price toward the $95 level.
Any more losses might call for a test of the 50% Fib retracement level of the upward move from the $78.14 swing low to the $106.45 high at $92.30.
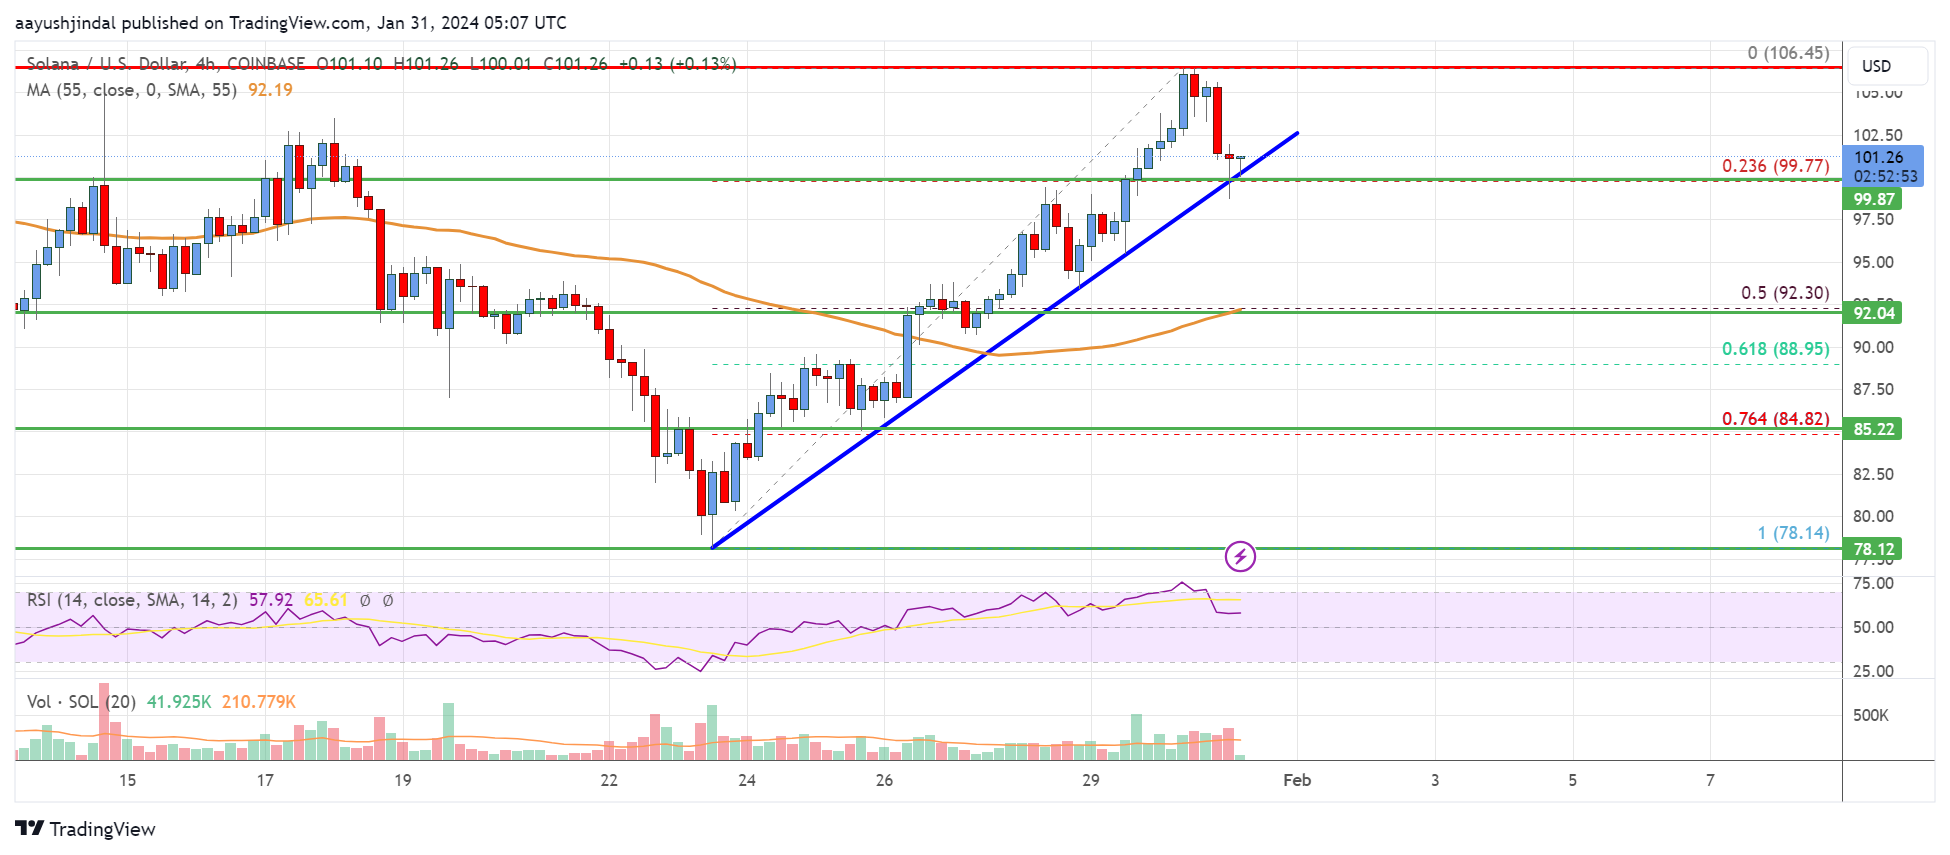
Looking at the chart, Solana price is clearly trading above $100 and the 55 simple moving average (4 hours). Overall, the price must clear $105 and $112 to continue higher in the near term.
Technical Indicators
4 hours MACD – The MACD is now losing momentum in the bullish zone.
4 hours RSI (Relative Strength Index) – The RSI is now above the 50 level.
Key Support Levels – $100 and $92.30.
Key Resistance Levels – $105, $112, and $120.
- SEO Powered Content & PR Distribution. Get Amplified Today.
- PlatoData.Network Vertical Generative Ai. Empower Yourself. Access Here.
- PlatoAiStream. Web3 Intelligence. Knowledge Amplified. Access Here.
- PlatoESG. Carbon, CleanTech, Energy, Environment, Solar, Waste Management. Access Here.
- PlatoHealth. Biotech and Clinical Trials Intelligence. Access Here.
- Source: https://www.livebitcoinnews.com/solana-sol-price-analysis-rally-could-extend-to-120/
- :is
- 14
- 23
- 30
- 45
- 50
- 500
- a
- above
- accelerate
- active
- against
- also
- an
- analysis
- and
- any
- At
- average
- base
- below
- Bitcoin
- Bitcoin News
- Break
- Bullish
- Bulls
- call
- Chart
- clear
- clearly
- Climbed
- coinbase
- Connecting
- consolidating
- continue
- could
- data
- decent
- Dollar
- downside
- Even
- extend
- For
- formed
- from
- Gains
- High
- higher
- HOURS
- HTTPS
- immediate
- in
- Increase
- index
- initial
- IT
- ITS
- Level
- levels
- like
- Line
- live
- Live Bitcoin News
- losing
- losses
- Low
- MACD
- major
- max-width
- might
- Momentum
- more
- move
- moving
- moving average
- must
- Near
- news
- next
- now
- of
- on
- overall
- pair
- plato
- Plato Data Intelligence
- PlatoData
- positive
- price
- Price Analysis
- Push
- rally
- relative
- relative strength index
- remained
- Resistance
- retracement
- rsi
- send
- Simple
- sits
- SOL
- SOL Price
- SOL/USD
- Solana
- Solana (SOL)
- Solana (SOL) Price
- Solana Price
- started
- strength
- strong
- support
- support level
- support levels
- Swing
- term
- test
- The
- There.
- to
- toward
- Trading
- TradingView
- Trend
- Upside
- upward
- us
- US Dollar
- was
- were
- which
- with
- zephyrnet
- zone