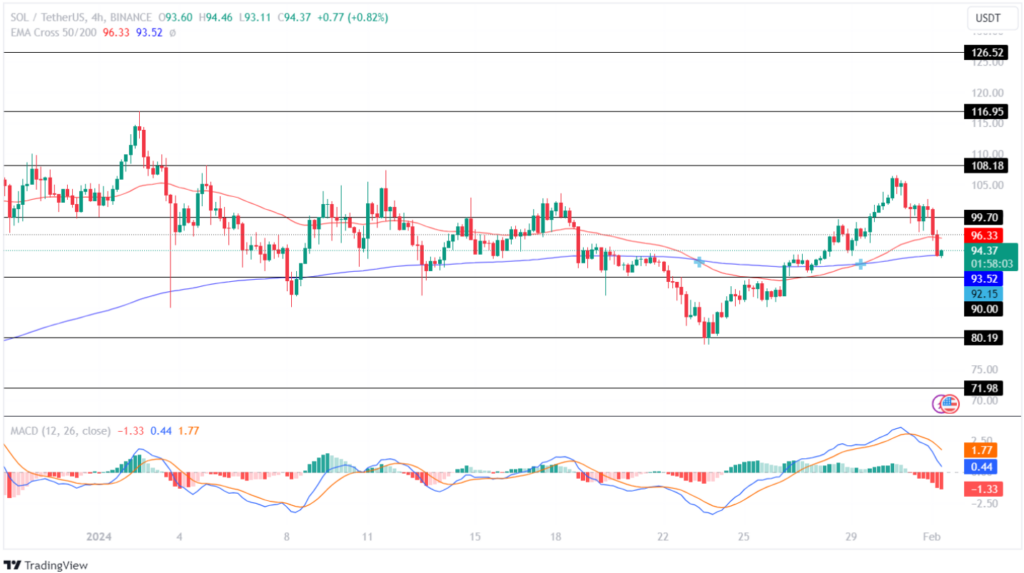
- SOL experienced a significant drop after being rejected at the $108 level.
- It traded between $99 and $108 for more than two weeks, showing a lack of bullish momentum.
- The formation of a “death cross” pattern suggests a potential for prolonged bearish trends.
Solana’s native token, SOL, plunged this week after facing rejection around the $108 level, sparking debate on whether the asset can reclaim lost ground in the near future.
SOL had traded rangebound between approximately $99 and $108 for over two weeks into late January, struggling to regain bullish momentum following a 20% correction from its mid-January highs above $116. The sideways chop reflected growing indecision in the market after SOL’s promising breakout attempt failed.
Eventually, however, selling pressure intensified as SOL slipped under its 50-day and 200-day moving averages, forming a so-called “death cross” pattern that typically precedes prolonged bearishness. The breakdown steepened a few days later, with SOL crashing below support around $90 to plumb two-week lows.
While bulls did manage to curb losses around $80, SOL met renewed resistance this week around $108 once again. The latest failed test shows sellers remain largely in control, with SOL dropping double-digits to currently trade around $95.
Solana shows mixed signals
With SOL looking technically vulnerable, analysts debate whether a lasting rebound awaits or if lower support levels could be retested. On one hand, the Moving Average Convergence Divergence (MACD) indicator shows a rising negative histogram, signifying robust downward momentum in play. Additionally, MACD’s sliding averages point to the potential for SOL to extend declines.
On the other hand, holding above $90 could help SOL consolidate before rechallenging range resistance around $100. In that scenario, reclaiming the latter could open the door towards $108, where SOL could confirm a bullish trend reversal.
However, failing to maintain the $90 support risks magnifying selling pressure for a retest of 2023 lows near $80. And should bearish momentum persist below that floor, some analysts warn SOL could plunge towards $72—a critical technical level that has underpinned multiple advances since 2021.
In summary, while SOL appears vulnerable having violated its multi-week trading range, reclaiming $90 and beyond could signal the asset is bottoming out for its next rally. Otherwise, traders may sidestep SOL until buyers unambiguously regain control to avoid getting caught in the turbulence. With mixed signals abounding, volatility is likely to persist in the near term.
- SEO Powered Content & PR Distribution. Get Amplified Today.
- PlatoData.Network Vertical Generative Ai. Empower Yourself. Access Here.
- PlatoAiStream. Web3 Intelligence. Knowledge Amplified. Access Here.
- PlatoESG. Carbon, CleanTech, Energy, Environment, Solar, Waste Management. Access Here.
- PlatoHealth. Biotech and Clinical Trials Intelligence. Access Here.
- Source: https://thenewscrypto.com/solana-faces-challenges-after-108-rejection-analysts-divided-on-sol/
- :has
- :is
- :where
- 2021
- 2023
- 26
- 36
- a
- above
- Additionally
- advances
- After
- again
- Analysts
- and
- appears
- approximately
- around
- AS
- asset
- At
- attempt
- average
- avoid
- BE
- bearish
- Bearish Momentum
- before
- being
- below
- between
- Beyond
- Breakdown
- breakout
- Bullish
- Bulls
- buttons
- buyers
- CAN
- caught
- challenges
- Confirm
- consolidate
- control
- Convergence
- could
- Crashing
- critical
- Currently
- Days
- debate
- Declines
- DID
- Divergence
- divided
- Door
- downward
- Drop
- Dropping
- experienced
- extend
- faces
- facing
- Failed
- failing
- few
- Floor
- following
- For
- formation
- from
- future
- getting
- Ground
- Growing
- had
- hand
- having
- help
- Highs
- holding
- However
- HTTPS
- if
- in
- Indicator
- intensified
- into
- ITS
- January
- Lack
- largely
- lasting
- Late
- later
- latest
- Level
- levels
- likely
- looking
- losses
- lost
- lower
- Lows
- MACD
- maintain
- manage
- Market
- max-width
- May..
- met
- mixed
- Momentum
- more
- moving
- moving average
- moving averages
- multiple
- native
- Native Token
- Near
- negative
- next
- of
- on
- once
- ONE
- open
- or
- Other
- otherwise
- out
- over
- Pattern
- PHP
- plato
- Plato Data Intelligence
- PlatoData
- Play
- plunge
- Point
- potential
- pressure
- promising
- rally
- range
- rangebound
- rebound
- reflected
- regain
- Rejected..
- remain
- renewed
- Resistance
- Reversal
- rising
- risks
- robust
- scenario
- Sellers
- Selling
- Share
- should
- showing
- Shows
- sideways
- Signal
- signals
- significant
- signifying
- since
- sliding
- SOL
- Solana
- some
- Struggling
- Suggests
- SUMMARY
- support
- support levels
- SVG
- Technical
- technically
- term
- test
- than
- that
- The
- this
- this week
- to
- token
- towards
- trade
- traded
- Traders
- Trading
- Trend
- Trends
- turbulence
- two
- typically
- under
- underpinned
- until
- violated
- Volatility
- Vulnerable
- week
- Weeks
- whether
- while
- with
- zephyrnet