Solana is attempting a fresh increase from the $92 zone. SOL price could gain bullish momentum if it manages to clear the $100 and $104 resistance levels.
- SOL price started a fresh decline from the $106 resistance against the US Dollar.
- The price is now trading above $92 and the 100 simple moving average (4 hours).
- There was a break below a key bullish trend line with support at $100 on the 4-hour chart of the SOL/USD pair (data source from Kraken).
- The pair could start another increase if it surpasses the $100 and $104 levels.
Solana Price Faces Key Test
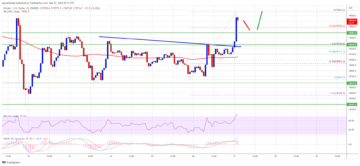
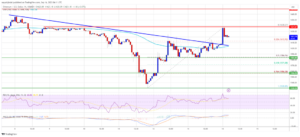
Solana price started a fresh decline after it struggled to clear the $106 level like Bitcoin at $43,800. There was a clear move below the $102 and $100 support levels.
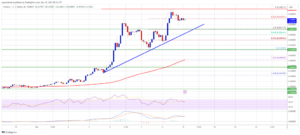
Besides, there was a break below a key bullish trend line with support at $100 on the 4-hour chart of the SOL/USD pair. However, the bulls were active near the $92 level and the 100 simple moving average (4 hours). The price is now attempting a fresh increase above the $95 level.
The price retested the $100 zone and the 50% Fib retracement level of the downward move from the $106.41 swing high to the $92.95 low. SOL is now trading above $95 and the 100 simple moving average (4 hours).
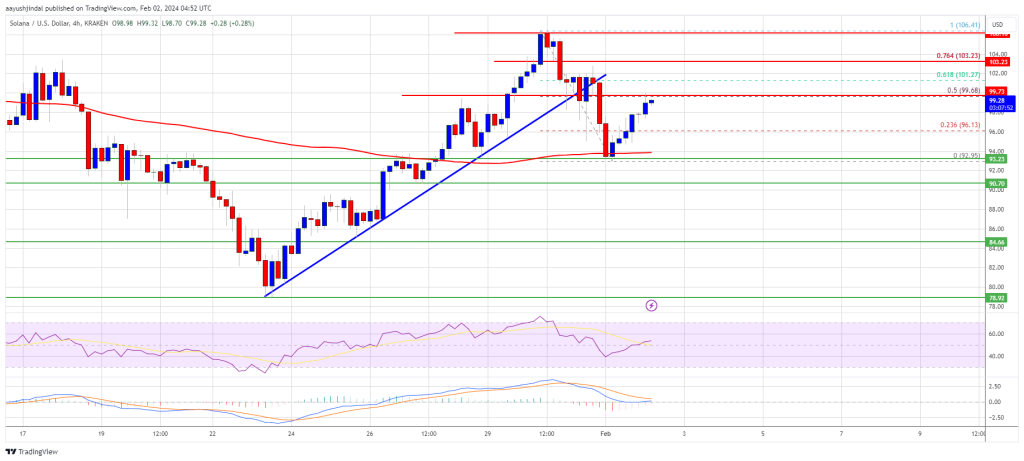
Source: SOLUSD on TradingView.com
Immediate resistance is near the $100 level. The next major resistance is near the $104 level or the 76.4% Fib retracement level of the downward move from the $106.41 swing high to the $92.95 low. A successful close above the $104 resistance could set the pace for another major increase. The next key resistance is near $112. Any more gains might send the price toward the $120 level.
Another Decline in SOL?
If SOL fails to rally above the $100 resistance, it could start another decline. Initial support on the downside is near the $92 level and the 100 simple moving average (4 hours).
The first major support is near the $90 level, below which the price could test $85. If there is a close below the $85 support, the price could decline toward the $78 support in the near term.
Technical Indicators
4-Hours MACD – The MACD for SOL/USD is gaining pace in the bullish zone.
4-Hours RSI (Relative Strength Index) – The RSI for SOL/USD is above the 50 level.
Major Support Levels – $92, and $92.
Major Resistance Levels – $100, $104, and $112.
Disclaimer: The article is provided for educational purposes only. It does not represent the opinions of NewsBTC on whether to buy, sell or hold any investments and naturally investing carries risks. You are advised to conduct your own research before making any investment decisions. Use information provided on this website entirely at your own risk.
- SEO Powered Content & PR Distribution. Get Amplified Today.
- PlatoData.Network Vertical Generative Ai. Empower Yourself. Access Here.
- PlatoAiStream. Web3 Intelligence. Knowledge Amplified. Access Here.
- PlatoESG. Carbon, CleanTech, Energy, Environment, Solar, Waste Management. Access Here.
- PlatoHealth. Biotech and Clinical Trials Intelligence. Access Here.
- Source: https://www.newsbtc.com/analysis/sol-price-faces-big-move-120/
- :is
- :not
- 1
- 100
- 41
- 50
- 800
- a
- above
- active
- advised
- After
- against
- and
- Another
- any
- ARE
- article
- At
- attempting
- average
- before
- below
- Big
- Break
- Bullish
- Bulls
- buy
- CAN
- Chart
- clear
- Close
- Conduct
- could
- data
- decisions
- Decline
- does
- Dollar
- downside
- downward
- educational
- entirely
- faces
- fails
- First
- For
- fresh
- fresh increase
- from
- Gain
- gaining
- Gains
- High
- hold
- HOURS
- However
- HTTPS
- if
- in
- Increase
- index
- information
- initial
- investing
- investment
- Investments
- IT
- Key
- key resistance
- Kraken
- Level
- levels
- like
- Line
- Low
- MACD
- major
- Making
- manages
- max-width
- might
- Momentum
- more
- move
- moving
- moving average
- Near
- NewsBTC
- next
- now
- of
- on
- only
- Opinions
- or
- own
- Pace
- pair
- plato
- Plato Data Intelligence
- PlatoData
- price
- provided
- purposes
- rally
- relative
- relative strength index
- represent
- research
- Resistance
- retracement
- Risk
- risks
- rsi
- sell
- send
- set
- Simple
- SOL
- SOL Price
- SOL/USD
- Solana
- Source
- start
- started
- strength
- successful
- support
- support levels
- surpasses
- Swing
- term
- test
- The
- There.
- this
- to
- toward
- Trading
- TradingView
- Trend
- us
- US Dollar
- use
- was
- Website
- were
- whether
- which
- with
- you
- Your
- zephyrnet
- zone