- Russell 2000 has staged a major bearish breakdown from its “Symmetrical Triangle” range support in place since June/September 2022 which also coincided with the current major swing lows areas of the Nasdaq 100 and S&P 500 formed last year.
- A further potential spike up in the ICE BofA US High Yield Index option-adjusted spread may trigger further downside pressure in the Russell 2000.
- Watch the key short-term resistance at 1,715.
This is a follow-up analysis of our prior report, “Russell 2000 Technical: The weakest among the major US stock indices” published on 14 September 2023. Click here for a recap.
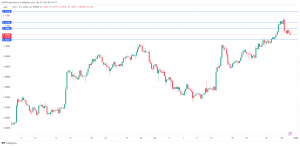
The US Russ 2000 Index (a proxy for the Russell 2000 futures) has indeed inched lower and staged a major bearish breakdown below a four-month “Symmetrical Triangle” range configuration in place since the June 2022 low of 1,1640 on the week of 9 October 2023.
Its 2023 year-to-date return as of the close of yesterday (24 October) US session stands at a loss of -4.64%, which clearly has underperformed the other US benchmark stock indices; Nasdaq 100 (+34.79%), S&P 500 (+10.63%), Dow Jones Industrial Average (-0.02%) over a similar period.
The small-cap Russell 2000 is considered a better proxy of the US economy as its constituents derive close to 80% of its revenue from the US and approximately 40% of the Russell 2000 Index is unprofitable. Hence, these “zombie companies “with lower credit ratings are likely dependent on a relatively high level of debt to maintain their business operations.
The recent significant surge in the longer-term US Treasury yields where the US 10-year Treasury yield has probed the psychological 5% level earlier this week with no clear signs of a bullish exhaustion condition yet to be seen.
Watch out for a potential upward spike in US high-yield corporate bonds’ credit spread
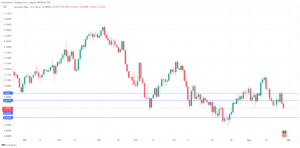
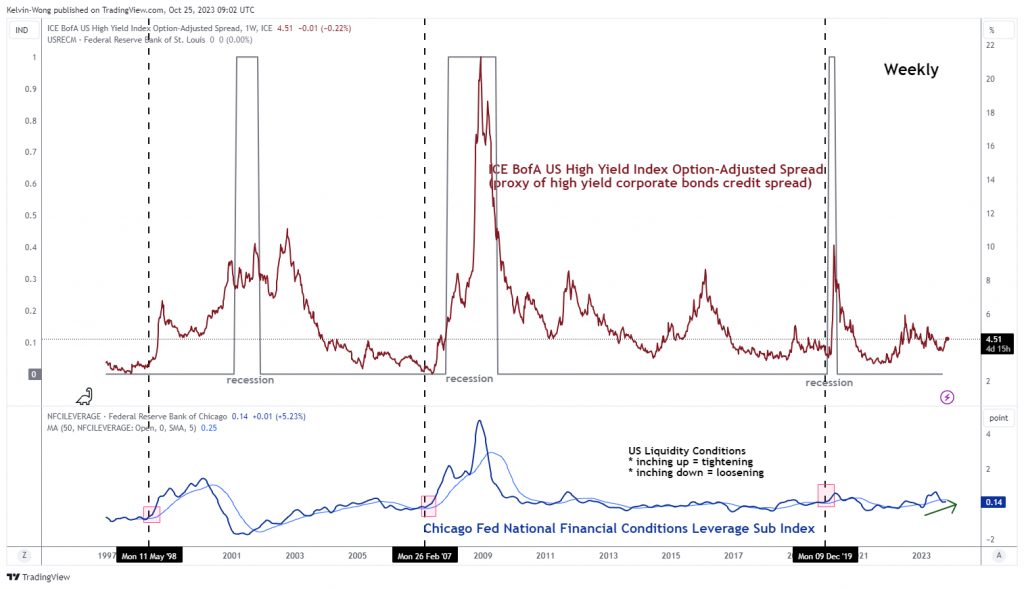
The lagging high-yield corporation bonds credit spread as indicated by the ICE BofA US High Yield Index option-adjusted spread has finally ticked higher in the past week to a five-month high of 4.51 as of Monday, 23 October due to a persistent upward movement of the US 10-year Treasury yield Also, the liquidity condition in the US has started to get tighter as seen by the recent movement of the Chicago Fed National Financial Conditions Leverage Sub Index that has shaped a “higher low” in (see figure 1).
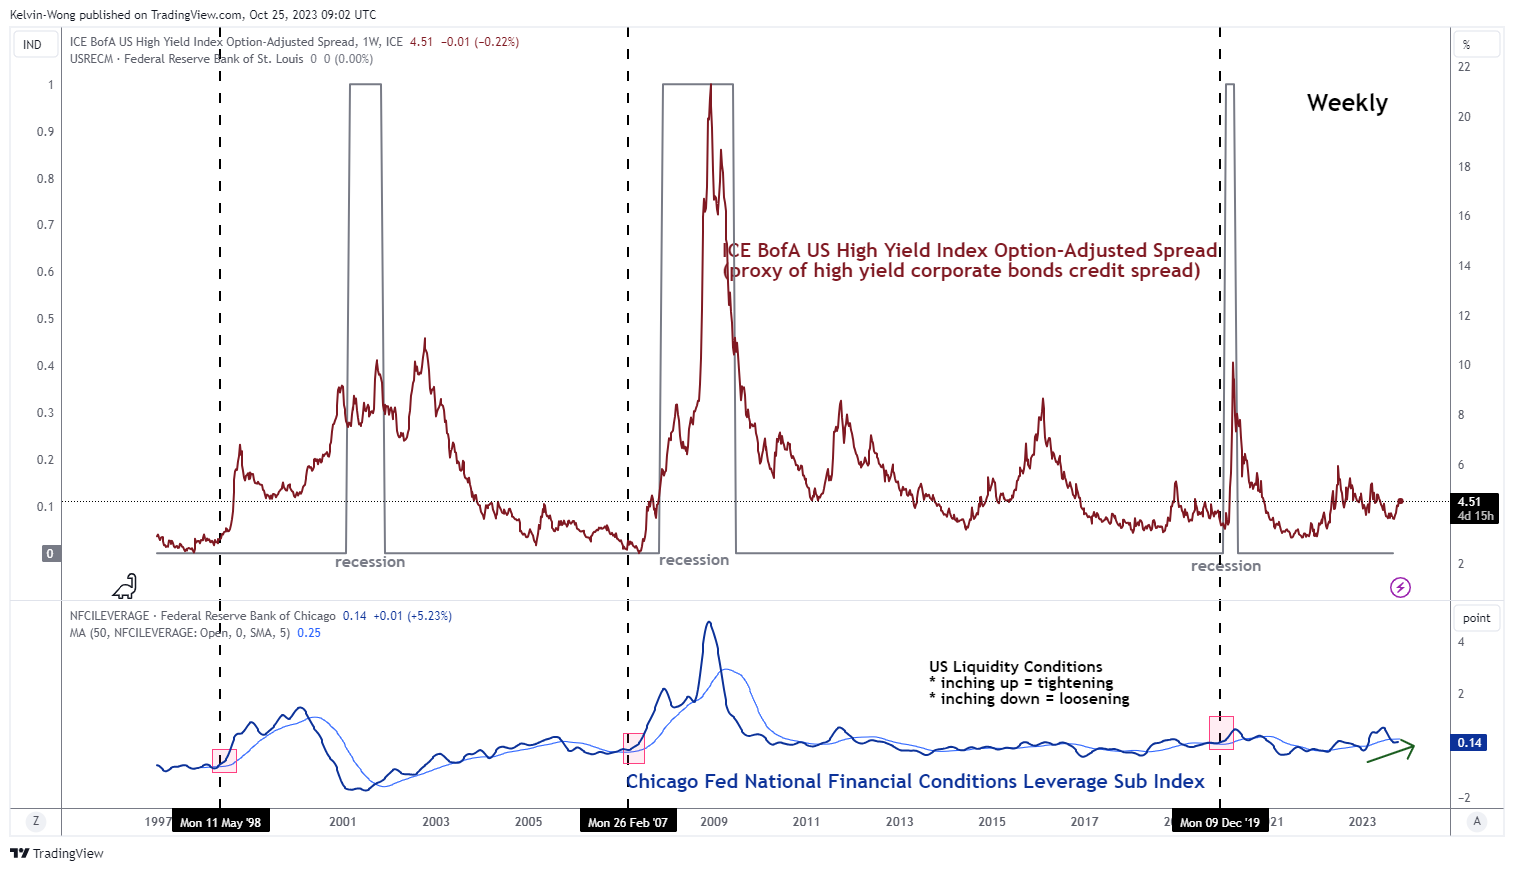
Fig 1: ICE BofA US High Yield Index Option-Adjusted Spread with US liquidity conditions as of 23 Oct 2023 (Source: TradingView, click to enlarge chart)
These key macro-observations suggest a higher cost of funding environment for lower credit rating US corporations that in turn lead to lower earnings growth and guidance that is likely to put further downside pressure on the Russell 2000 in Q4 which in turn increases the odds of a recession in the US in early 2024.
Oscillating within a medium-term descending channel
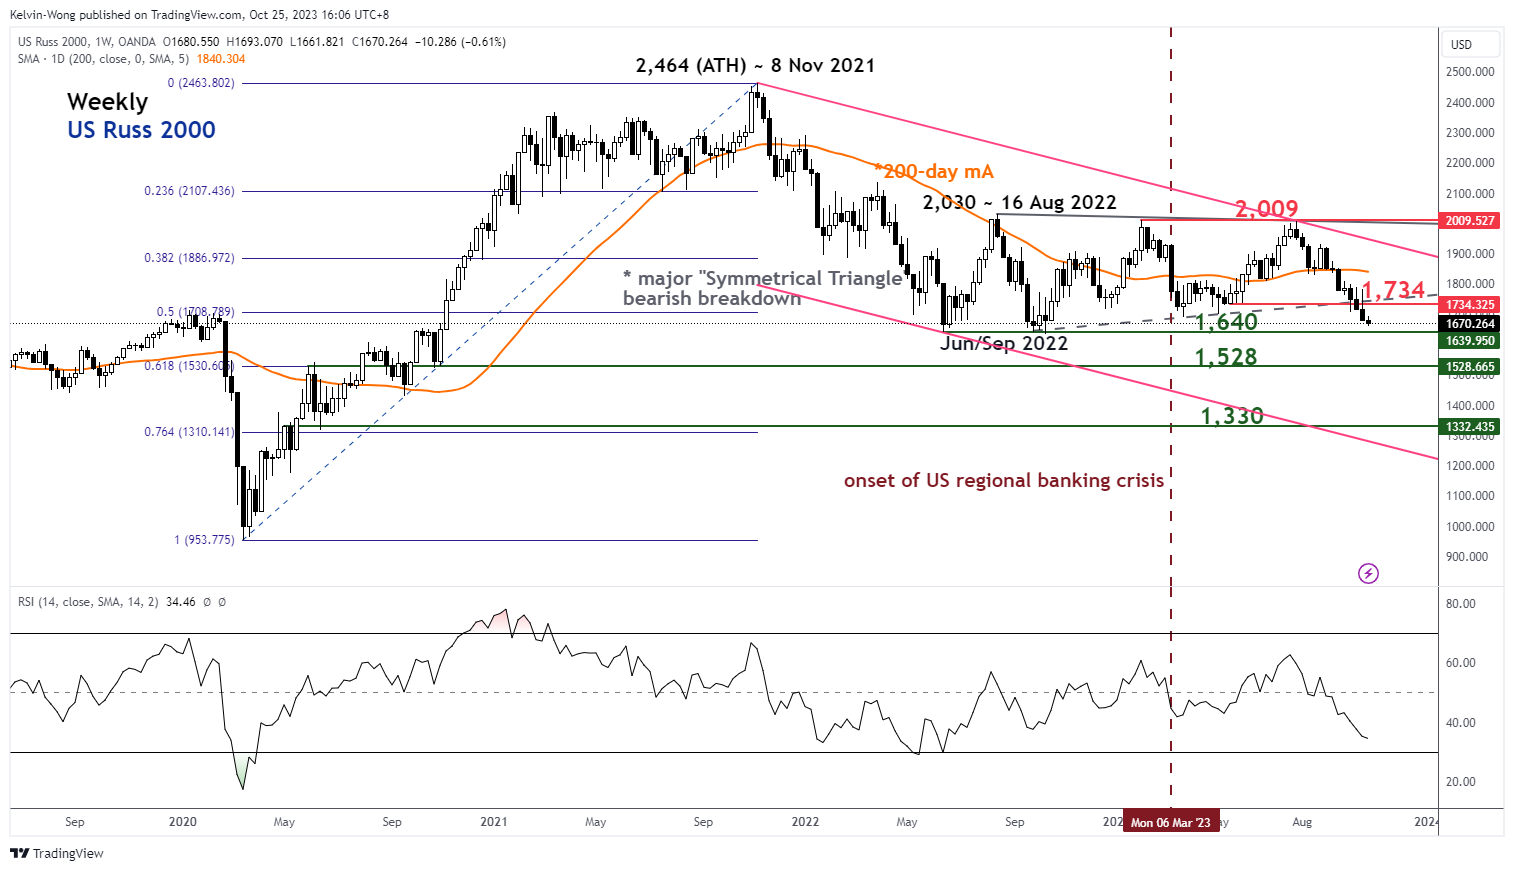
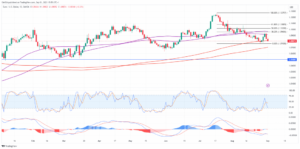
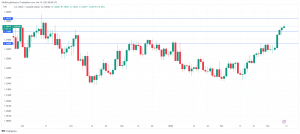
Fig 2: US Russ 2000 major trend as of 25 Oct 2023 (Source: TradingView, click to enlarge chart)
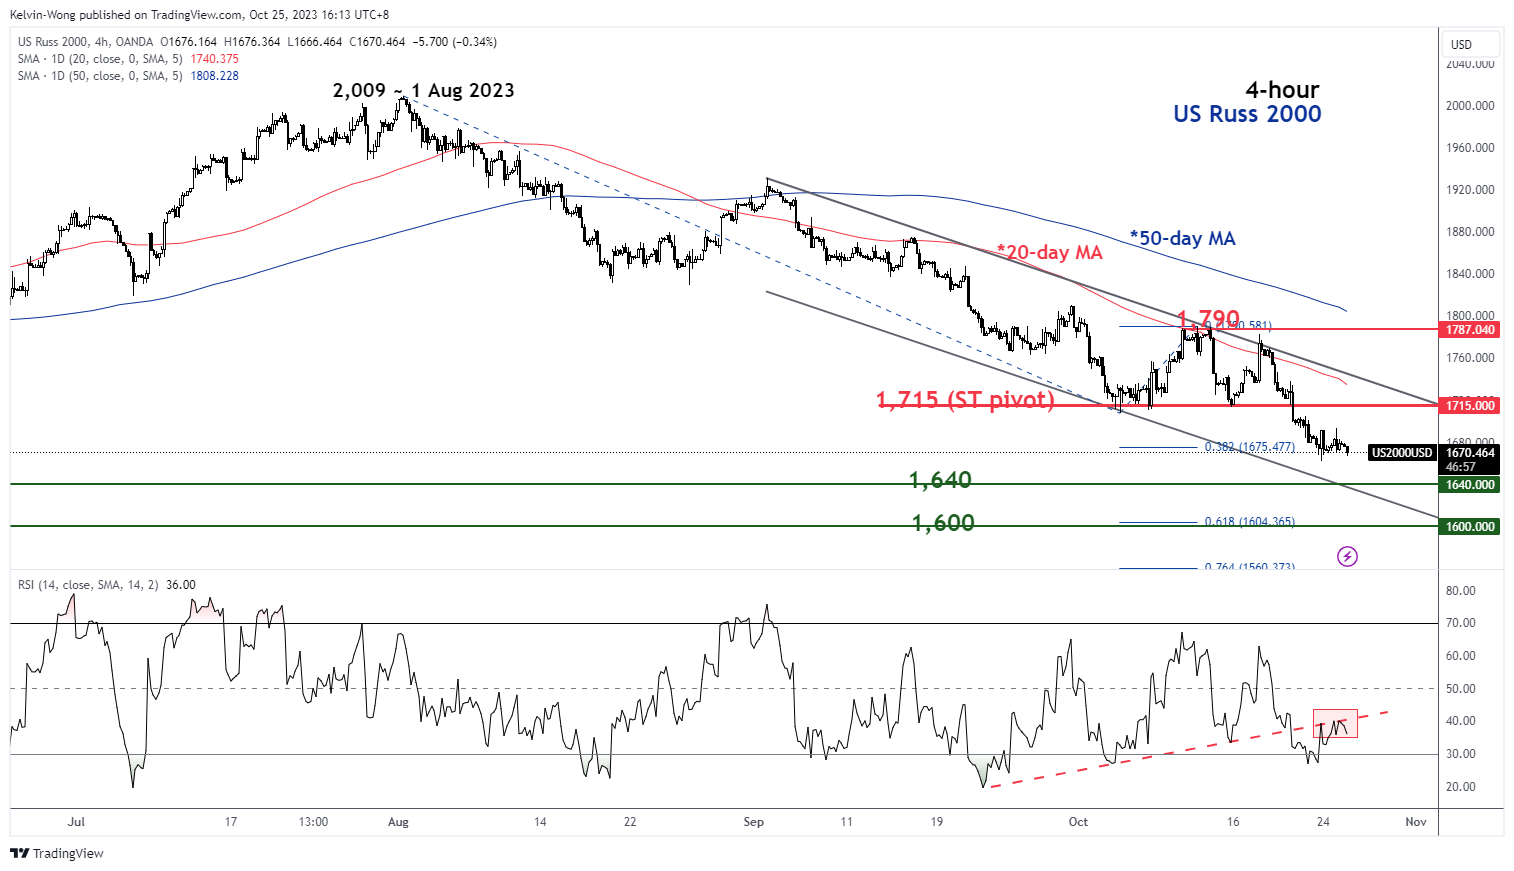
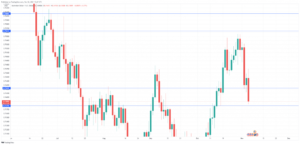
Fig 3: US Russ 2000 short and medium trends as of 25 Oct 2023 (Source: TradingView, click to enlarge chart)
Since its bearish breakdown from its major “Symmetrical Triangle” in early October 2023, the price actions of the US Russ 2000 Index are still evolving within a medium-term downtrend phase.
In addition, the bearish momentum remains intact as depicted by the 4-hour RSI momentum indicator that has just staged a bearish reaction off its parallel resistance at the 40 level and has not reached its oversold region (below 30).
Watch the 1,715 key short-term pivotal resistance (also the downward-slopping 20-day moving average) for a potential extension of the current impulsive down move sequence towards the next intermediate supports at 1,640 and 1,600.
However, a clearance above 1,715 negates the bearish tone to see the next intermediate resistance coming in at 1,790 (also, the 50-day moving average).
Content is for general information purposes only. It is not investment advice or a solution to buy or sell securities. Opinions are the authors; not necessarily that of OANDA Business Information & Services, Inc. or any of its affiliates, subsidiaries, officers or directors. If you would like to reproduce or redistribute any of the content found on MarketPulse, an award winning forex, commodities and global indices analysis and news site service produced by OANDA Business Information & Services, Inc., please access the RSS feed or contact us at info@marketpulse.com. Visit https://www.marketpulse.com/ to find out more about the beat of the global markets. © 2023 OANDA Business Information & Services Inc.
Latest posts by Kelvin Wong (see all)
- SEO Powered Content & PR Distribution. Get Amplified Today.
- PlatoData.Network Vertical Generative Ai. Empower Yourself. Access Here.
- PlatoAiStream. Web3 Intelligence. Knowledge Amplified. Access Here.
- PlatoESG. Carbon, CleanTech, Energy, Environment, Solar, Waste Management. Access Here.
- PlatoHealth. Biotech and Clinical Trials Intelligence. Access Here.
- Source: https://www.marketpulse.com/indices/russell-2000-technical-the-weakest-may-get-weaker-again/kwong
- :has
- :is
- :not
- :where
- ][p
- $UP
- 1
- 100
- 14
- 15 years
- 15%
- 2000
- 2022
- 2023
- 2024
- 23
- 24
- 25
- 30
- 40
- 500
- 51
- 700
- 9
- a
- About
- above
- access
- actions
- addition
- advice
- affiliates
- again
- also
- among
- an
- analyses
- analysis
- and
- any
- approximately
- ARE
- areas
- around
- AS
- At
- author
- authors
- avatar
- average
- award
- BE
- bearish
- Bearish Momentum
- beat
- below
- Benchmark
- Better
- Bofa
- Bonds
- Box
- Breakdown
- Bullish
- business
- business operations
- buttons
- buy
- by
- Chart
- chicago
- Chicago Fed
- clear
- clear signs
- clearance
- clearly
- click
- Close
- coincided
- COM
- combination
- coming
- Commodities
- Companies
- condition
- conditions
- conducted
- Configuration
- Connecting
- considered
- contact
- content
- Corporate
- CORPORATION
- Corporations
- Cost
- courses
- credit
- credit rating
- Current
- Debt
- dependent
- Directors
- dow
- Dow Jones
- Dow Jones Industrial Average
- down
- downside
- due
- Earlier
- Early
- Earnings
- economy
- Elliott
- enlarge
- Environment
- Ether (ETH)
- evolving
- exchange
- experience
- expert
- extension
- Fed
- Figure
- Finally
- financial
- Find
- flow
- For
- foreign
- foreign exchange
- forex
- formed
- found
- from
- fund
- fundamental
- funding
- further
- Futures
- General
- get
- Global
- global markets
- Growth
- guidance
- hence
- High
- High Yield
- higher
- HTTPS
- ICE
- if
- impulsive
- in
- Inc.
- Increases
- index
- indicated
- Indicator
- Indices
- industrial
- information
- Intermediate
- investment
- IT
- ITS
- jones
- june
- just
- Kelvin
- Key
- lagging
- Last
- Last Year
- lead
- Level
- levels
- Leverage
- like
- likely
- Liquidity
- loss
- Low
- lower
- Lows
- Macro
- maintain
- major
- Market
- market outlook
- market research
- MarketPulse
- Markets
- max-width
- May..
- medium
- Momentum
- Monday
- more
- move
- movement
- moving
- moving average
- Nasdaq
- Nasdaq 100
- National
- necessarily
- news
- next
- no
- numerous
- Oct
- october
- Odds
- of
- off
- officers
- on
- only
- Operations
- Opinions
- or
- Other
- our
- out
- Outlook
- over
- Parallel
- passionate
- past
- period
- perspectives
- phase
- photo
- pivotal
- Place
- plato
- Plato Data Intelligence
- PlatoData
- please
- positioning
- Posts
- potential
- pressure
- price
- Prior
- Produced
- providing
- proxy
- psychological
- published
- purposes
- put
- range
- rating
- ratings
- reached
- reaction
- recap
- recent
- recession
- region
- relatively
- remains
- report
- research
- Resistance
- retail
- return
- revenue
- Reversal
- rsi
- rss
- S&P
- S&P 500
- Securities
- see
- seen
- sell
- senior
- September
- Sequence
- service
- Services
- session
- shaped
- sharing
- Short
- short-term
- significant
- Signs
- similar
- since
- Singapore
- site
- solution
- Source
- specializing
- spike
- spread
- stands
- started
- Still
- stock
- Stock markets
- Strategist
- subsidiaries
- suggest
- support
- Supports
- surge
- Swing
- Technical
- Technical Analysis
- ten
- that
- The
- their
- These
- this
- this week
- thousands
- tighter
- to
- TONE
- towards
- Traders
- Trading
- TradingView
- Training
- treasury
- Treasury yields
- Trend
- Trends
- trigger
- TURN
- unique
- upward
- us
- US economy
- US Treasury
- US treasury yields
- using
- v1
- Visit
- Wave
- week
- WELL
- which
- winning
- with
- within
- wong
- would
- year
- years
- yesterday
- yet
- Yield
- yields
- you
- zephyrnet