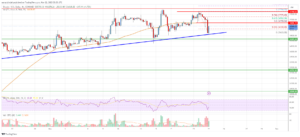
- Ripple price started a fresh decline from the $0.490 zone against the US dollar.
- The price is now trading below $0.480 and the 55 simple moving average (4 hours).
- There is a key rising channel forming with support near $0.4550 on the 4-hour chart of the XRP/USD pair (data source from Bittrex).
- The pair could extend losses if it stays below the $0.490 resistance zone.
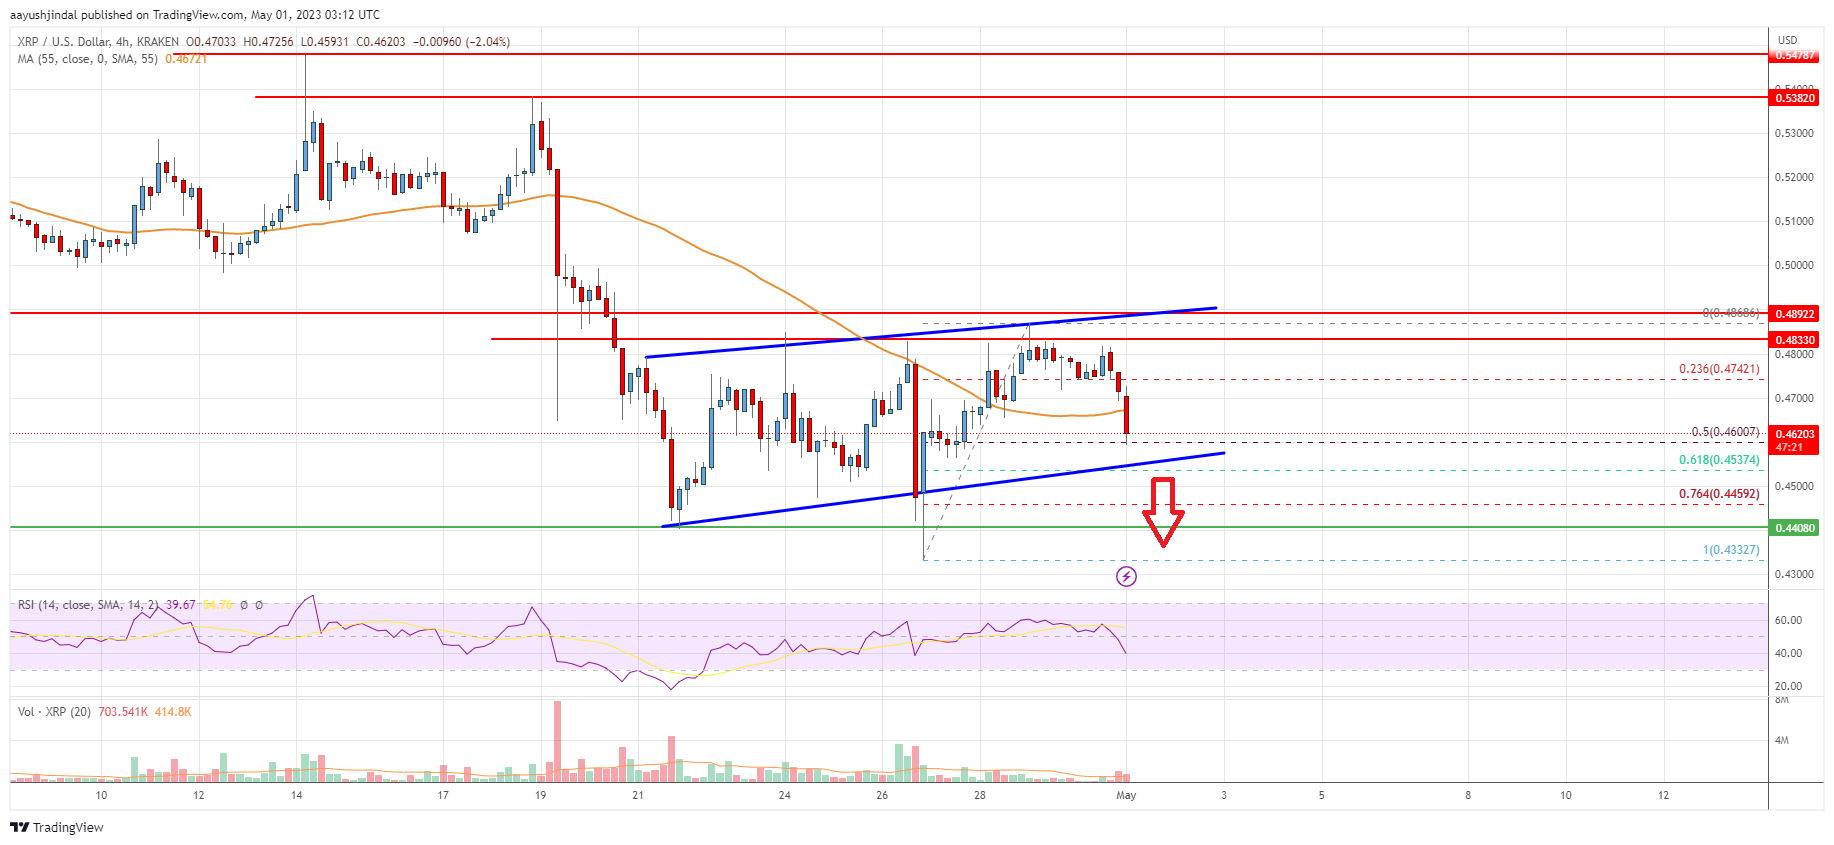
Ripple price is struggling below $0.490 against the US Dollar, similar to Bitcoin. XRP price could decline heavily if it breaks the $0.440 support in the near term.
Ripple Price Analysis
This past week, Ripple price attempted an upside break above the $0.500 zone against the US Dollar. The XRP/USD pair failed to gain bullish momentum and formed a high near $0.4868.
The price started a fresh bearish wave and declined below the $0.4750 support. It even traded below the $0.470 level and spiked below the 55 simple moving average (4 hours). It is now testing the 50% Fib retracement level of the upward move from the $0.4322 swing low to the $0.4868 high.
XRP is now trading below $0.480 and the 55 simple moving average (4 hours). Besides, there is a key rising channel forming with support near $0.4550 on the 4-hour chart of the XRP/USD pair.
On the upside, the price is facing resistance near $0.470. The next major resistance is near the $0.485 level. A clear move above the $0.4850 and $0.4900 resistance zones might start a fresh increase. In the stated case, the price could even surpass the $0.5000 resistance. Any more gains might send the price toward the $0.520 resistance.
Initial support on the downside is near $0.460. The next major support is near the $0.455 level and the channel trend line. It is close to the 61.8% Fib retracement level of the upward move from the $0.4322 swing low to the $0.4868 high. Any more losses could lead the price toward the $0.440 level, below which the price might even test $0.4000.
Ripple Price
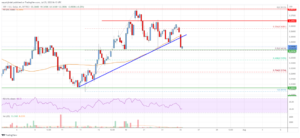
Looking at the chart, Ripple’s price is now trading below the $0.490 zone and the 55 simple moving average (4 hours). Overall, the price could extend losses if it stays below the $0.490 resistance zone.
Technical indicators
4 hours MACD – The MACD for XRP/USD is now gaining momentum in the bearish zone.
4 hours RSI (Relative Strength Index) – The RSI for XRP/USD is below the 50 level.
Key Support Levels – $0.4600, $0.4550, and $0.4400.
Key Resistance Levels – $0.4850 and $0.4900.
- SEO Powered Content & PR Distribution. Get Amplified Today.
- PlatoAiStream. Web3 Data Intelligence. Knowledge Amplified. Access Here.
- Minting the Future w Adryenn Ashley. Access Here.
- Source: https://www.livebitcoinnews.com/ripple-price-analysis-xrp-could-dive-below-0-44/
- :is
- 50
- 500
- 5000
- a
- above
- against
- an
- analysis
- and
- any
- At
- attempted
- average
- bearish
- below
- besides
- bittrex
- Break
- breaks
- Bullish
- case
- Channel
- Chart
- clear
- Close
- comments
- could
- data
- Decline
- Dollar
- downside
- end
- Even
- extend
- facing
- Failed
- follow
- For
- formed
- fresh
- fresh increase
- from
- Gain
- gaining
- Gains
- heavily
- High
- HOURS
- HTTPS
- if
- in
- Increase
- index
- internal
- IT
- Key
- lead
- Level
- levels
- Line
- losses
- Low
- MACD
- major
- might
- Momentum
- more
- move
- moving
- moving average
- Near
- next
- now
- of
- on
- overall
- past
- plato
- Plato Data Intelligence
- PlatoData
- Post
- price
- Price Analysis
- relative strength index
- Resistance
- retracement
- Ripple
- ripple price
- Ripple Price Analysis
- rising
- rsi
- send
- similar
- Simple
- Source
- start
- started
- stated
- strength
- Struggling
- support
- support levels
- surpass
- Swing
- TAG
- test
- Testing
- The
- There.
- to
- toward
- traded
- Trading
- TradingView
- Trend
- Upside
- upward
- us
- US Dollar
- Wave
- week
- which
- with
- xrp
- XRP Price
- XRP/USD
- zephyrnet
- zones