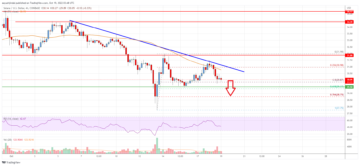
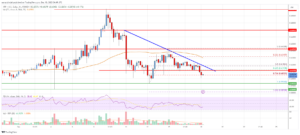
- Ripple price started a fresh decline from the $0.4050 zone against the US dollar.
- The price is now trading above $0.3850 and the 55 simple moving average (4-hours).
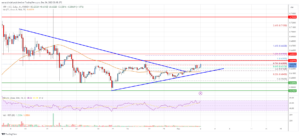
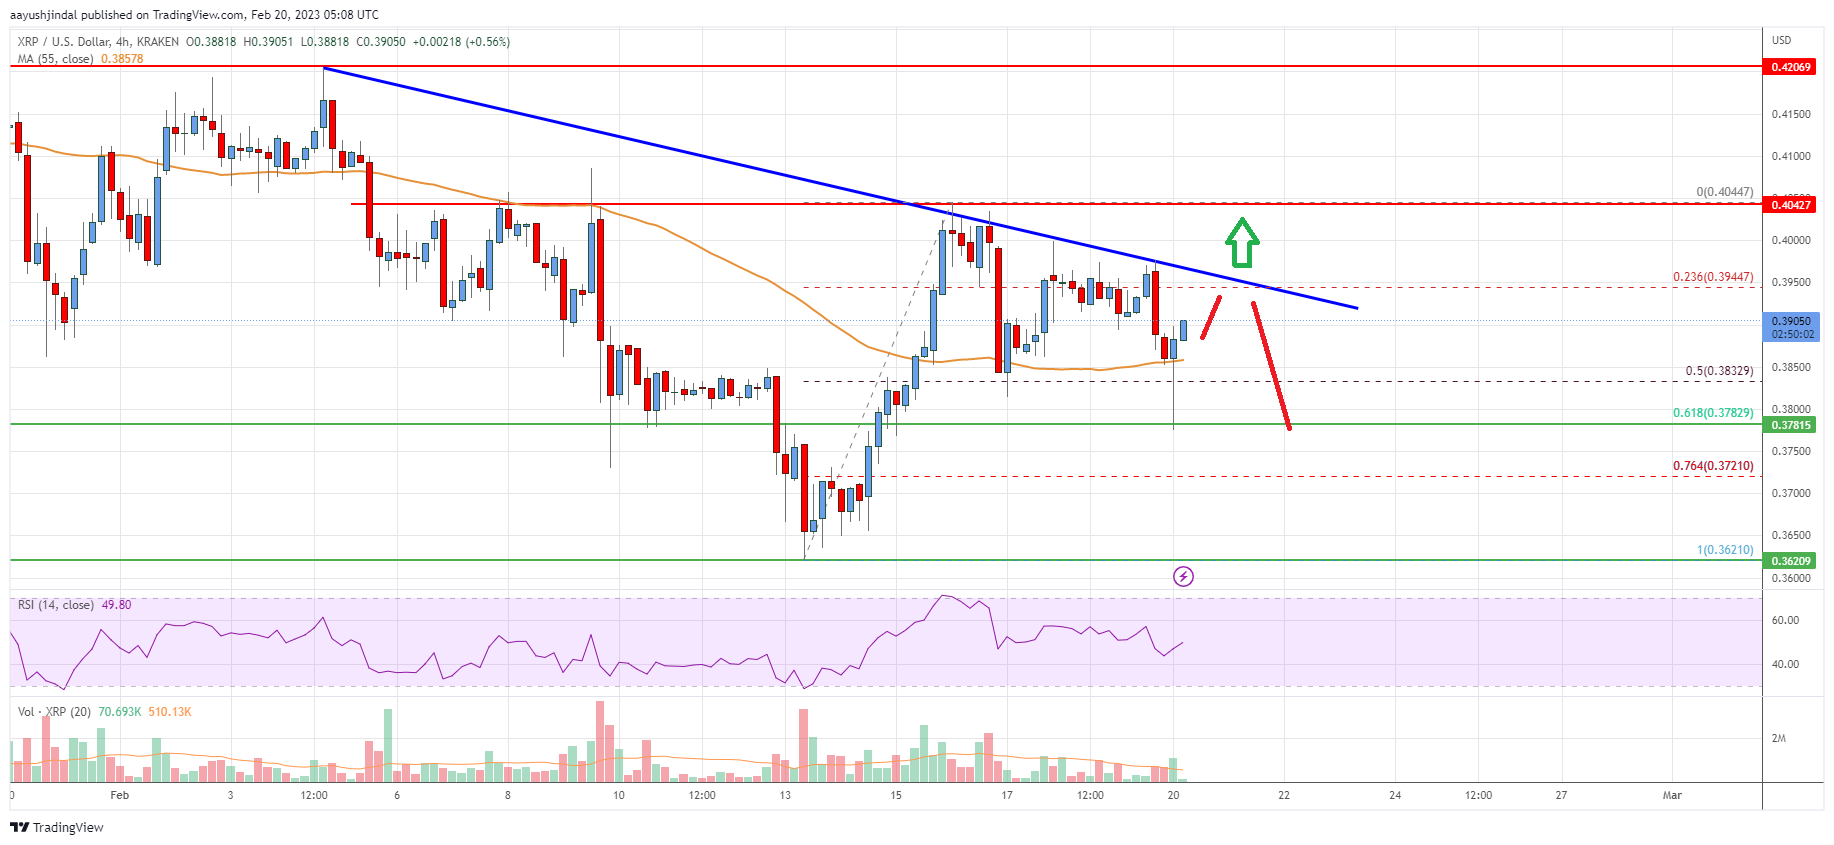
- There is a key bearish trend line forming with resistance near $0.3950 on the 4-hours chart of the XRP/USD pair (data source from Bittrex).
- The pair could extend losses if it stays below the $0.4050 resistance zone.
Ripple price is struggling below $0.4050 against the US Dollar, similar to bitcoin. XRP price must stay above $0.3780 to avoid more downsides in the near term.
Ripple Price Analysis
This past week, ripple price saw a bearish reaction below the $0.3800 zone against the US Dollar. The XRP/USD pair declined below the $0.3650 support zone to move into a bearish zone.
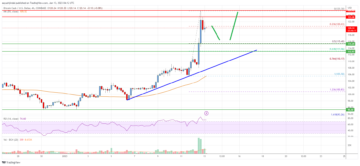
The pair traded as low $0.3620 before there was a decent recovery wave. The price was able to climb above the $0.3850 resistance zone and the 55 simple moving average (4-hours). It even spiked above the $0.4000 level before the bears appeared near $0.4050.
A high is formed near $0.4044 and the price is now trading in a range. On the upside, the price is facing resistance near $0.3940. There is also a key bearish trend line forming with resistance near $0.3950 on the 4-hours chart of the XRP/USD pair.
The next major resistance is near the $0.4000 level. The main resistance is near the $0.4050 zone. A clear move above the $0.4040 and $0.4050 resistance zones might start a fresh increase. In the stated case, the price could even surpass the $0.4150 resistance. Any more gains might send the price towards the $0.435 resistance.
An initial support on the downside is near the $0.3830. It is near the 50% Fib retracement level of the upward move from the $0.3621 swing low to $0.4044 high.
The next major support is near the $0.3780 level or the 61.8% Fib retracement level of the upward move from the $0.3621 swing low to $0.4044 high, below which the price could even test the $0.3620 support. Any more losses could lead the price towards the $0.3500 level, below which the price might even test $0.3200.
Ripple Price
Looking at the chart, ripple price is now trading above the $0.380 zone and the 55 simple moving average (4-hours). Overall, the price could extend losses if it stays below the $0.4050 resistance zone.
Technical indicators
4 hours MACD – The MACD for XRP/USD is now losing momentum in the bearish zone.
4 hours RSI (Relative Strength Index) – The RSI for XRP/USD is near the 50 level.
Key Support Levels – $0.3780, $0.3620 and $0.3500.
Key Resistance Levels – $0.3950 and $0.4050.
- SEO Powered Content & PR Distribution. Get Amplified Today.
- Platoblockchain. Web3 Metaverse Intelligence. Knowledge Amplified. Access Here.
- Source: https://www.livebitcoinnews.com/ripple-price-analysis-risk-of-more-losses-below-0-38/
- a
- Able
- above
- against
- analysis
- and
- appeared
- average
- bearish
- Bears
- before
- below
- bittrex
- case
- Chart
- clear
- climb
- comments
- could
- data
- Decline
- Dollar
- downside
- downsides
- Even
- extend
- facing
- follow
- formed
- fresh
- fresh increase
- from
- Gains
- High
- HOURS
- HTTPS
- in
- Increase
- index
- initial
- internal
- IT
- Key
- lead
- Level
- levels
- Line
- losing
- losses
- Low
- MACD
- Main
- major
- might
- Momentum
- more
- move
- moving
- moving average
- Near
- next
- overall
- past
- plato
- Plato Data Intelligence
- PlatoData
- Post
- price
- Price Analysis
- range
- reaction
- recovery
- relative strength index
- Resistance
- retracement
- Ripple
- ripple price
- Ripple Price Analysis
- Risk
- rsi
- similar
- Simple
- Source
- start
- started
- stated
- stay
- strength
- Struggling
- support
- support levels
- surpass
- TAG
- test
- The
- to
- towards
- traded
- Trading
- TradingView
- Trend
- Upside
- upward
- us
- US Dollar
- Wave
- week
- which
- xrp
- XRP Price
- XRP/USD
- zephyrnet
- zones