- Ripple price started a downside correction below the $0.820 zone against the US dollar.
- The price is now trading below $0.80 and the 55 simple moving average (4 hours).
- There is a key bearish trend line forming with resistance near $0.738 on the 4-hour chart of the XRP/USD pair (data source from Kraken).
- The pair could start a fresh increase above the $0.750 resistance.
Ripple price is consolidating near $0.720 against the US Dollar, similar to Bitcoin. XRP price must stay above the $0.70 support to start a fresh increase.
Ripple Price Analysis
This past week, Ripple price made another attempt to clear the $0.850 resistance against the US Dollar. The XRP/USD pair struggled to clear $0.850 and started a downside correction.
There was a move below the $0.820 and $0.800 support levels. However, the bulls were active above the $0.70 support. A low is formed near $0.715 and the price is now consolidating losses. XRP is now trading below $0.80 and the 55 simple moving average (4 hours).
On the upside, the price is facing resistance near $0.735. There is also a key bearish trend line forming with resistance near $0.738 on the 4-hour chart of the XRP/USD pair.
The trend line is near the 23.6% Fib retracement level of the downward move from the $0.8525 swing high to the $0.7156 low. The next major resistance is near the $0.750 level. A clear move above the $0.750 resistance zone might start a strong increase.
In the stated case, the price could even surpass the $0.785 resistance or the 50% Fib retracement level of the downward move from the $0.8525 swing high to the $0.7156 low. Any more gains might send the price toward the $0.850 resistance.
Initial support on the downside is near the $0.715 level. The next major support is near the $0.70 level. Any more losses could lead the price toward the $0.650 level, below which the price might even test the $0.620 support zone in the near term.
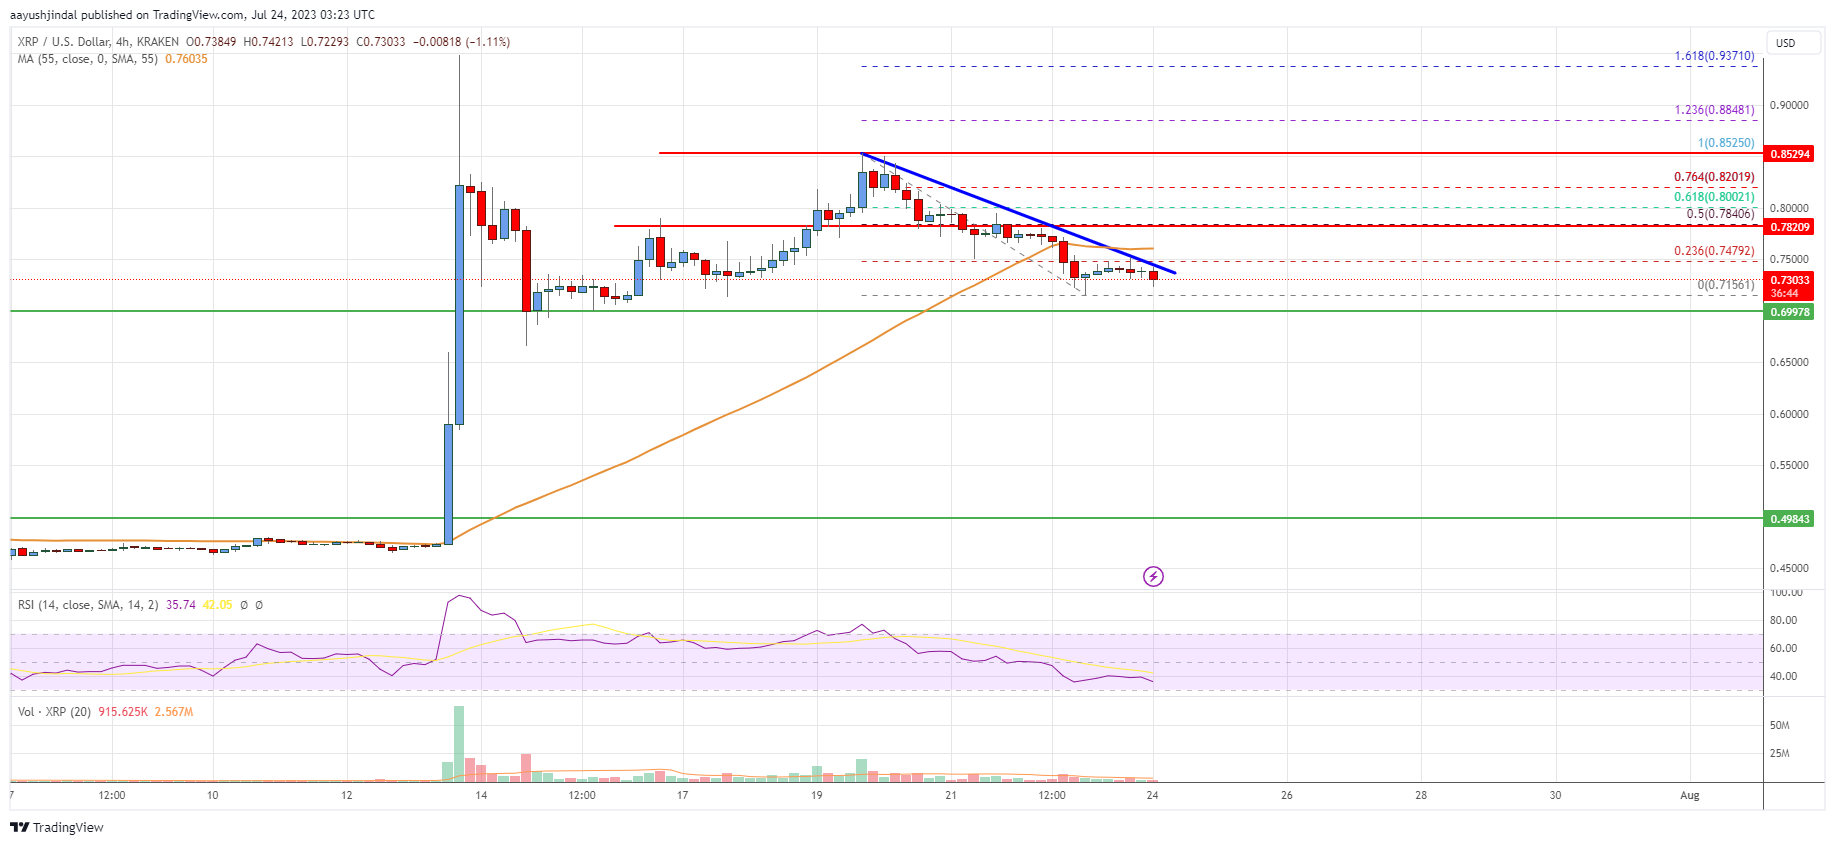
Looking at the chart, Ripple’s price is now trading below the $0.80 zone and the 55 simple moving average (4 hours). Overall, the price could start a fresh increase above the $0.75 resistance.
Technical indicators
4 hours MACD – The MACD for XRP/USD is now losing momentum in the bearish zone.
4 hours RSI (Relative Strength Index) – The RSI for XRP/USD is below the 50 level.
Key Support Levels – $0.715, $0.700, and $0.650.
Key Resistance Levels – $0.735 and $0.750.
- SEO Powered Content & PR Distribution. Get Amplified Today.
- PlatoData.Network Vertical Generative Ai. Empower Yourself. Access Here.
- PlatoAiStream. Web3 Intelligence. Knowledge Amplified. Access Here.
- PlatoESG. Automotive / EVs, Carbon, CleanTech, Energy, Environment, Solar, Waste Management. Access Here.
- BlockOffsets. Modernizing Environmental Offset Ownership. Access Here.
- Source: https://www.livebitcoinnews.com/ripple-price-analysis-bulls-protect-uptrend-support-aims-fresh-rally/
- :is
- 23
- 50
- 70
- 75
- 80
- a
- above
- active
- against
- aims
- also
- analysis
- and
- Another
- any
- At
- average
- bearish
- below
- Bitcoin
- Bitcoin News
- Bulls
- case
- Chart
- clear
- consolidating
- could
- data
- Dollar
- downside
- downward
- Even
- facing
- For
- formed
- fresh
- fresh increase
- from
- Gains
- High
- HOURS
- However
- HTTPS
- in
- Increase
- index
- Key
- Kraken
- lead
- Level
- levels
- Line
- live
- Live Bitcoin News
- losing
- losses
- Low
- MACD
- made
- major
- max-width
- might
- Momentum
- more
- move
- moving
- moving average
- must
- Near
- news
- next
- now
- of
- on
- or
- overall
- pair
- past
- plato
- Plato Data Intelligence
- PlatoData
- price
- Price Analysis
- protect
- rally
- relative
- relative strength index
- Resistance
- retracement
- Ripple
- ripple price
- Ripple Price Analysis
- rsi
- send
- similar
- Simple
- Source
- start
- started
- stated
- stay
- strength
- strong
- support
- support levels
- surpass
- Swing
- term
- test
- The
- There.
- to
- toward
- Trading
- TradingView
- Trend
- Upside
- uptrend
- us
- US Dollar
- was
- week
- were
- which
- with
- xrp
- XRP Price
- XRP/USD
- zephyrnet