
January 22, 2024
Public Schools Leaders Report 90 Percent Average Daily Student Attendance Rate in November 2023
The first of three items from the folks at IES that may have some interest among readers of this space.
Public Schools Leaders Report 90 Percent Average Daily Student Attendance Rate in November 2023
The National Center for Education Statistics (NCES) releases today the latest round of findings from the School Pulse Panel (SPP). These SPP data examine topics on attendance and absenteeism, school lunch programs and school improvement plans during the 2023-24 school year as reported by school leaders in U.S. public schools. Key Findings
Attendance and Absenteeism
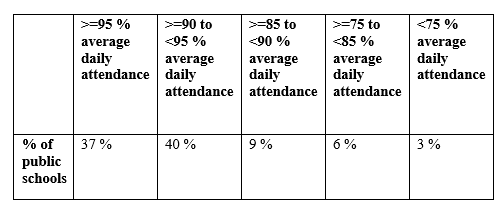
- Public school leaders nationwide reported their average daily attendance rate was 90 percent as of November 2023.
- Public schools reported daily attendance rates that fall into the following groups:
- When asked about their concerns related to student attendance and absences as of November 2023, the ability to obtain substitute teachers was the most concerning issue, with 35 percent of public schools reporting being “extremely concerned” about this issue.
- Fifteen percent of public schools reported being “extremely concerned” about student absences; extreme concern related to teacher and non-teaching staff absences were reported by lower percentages of schools (8 and 7 percent, respectively).
- Higher percentages of public schools with the following characteristics reported being “extremely concerned” about student absences compared to the national estimate (15 percent):
- In high-poverty neighborhoods (26 percent)
- With a student body made up of 76 percent or more students of color (26 percent)
- High/secondary schools (21 percent)
Supply Chain-Related Procurement Challenges & School Lunch Programs
- There was a 31-point decrease in the percentage of public schools reporting any supply chain-related procurement challenges for the 2023-24 school year compared to the 2022-23 school year (52 percent versus 83 percent).
- The top procurement challenges facing public schools during the 2023-24 school year are related to food services (27 percent) and laptops and other electronic devices (23 percent).
- Ninety-two percent of public schools reported participating in United States Department of Agriculture (USDA) meal programs for the 2023-24 school year, a higher percentage that reported doing so than last school year (88 percent). Four percent of public schools reported offering a non-USDA school meal program.
- Of these schools, the top challenges they reported in operating their school meal programs for the 2023-24 school year were:
- School food service staff shortages (41 percent)
- Convincing parents to submit applications for free- or-reduced price meals (38 percent)
- Increased program costs (21percent)
School Improvement Plans (SIP)
- The Elementary and Secondary Education Act of 1965 (ESEA), as amended, requires that states identify a school for comprehensive support and improvement (CSI) if it is a Title I school in the lowest 5 percent of Title I schools based on the state’s accountability system, a public high school failing to graduate one third or more of its students, or a Title I school that was previously identified for additional targeted support and improvement (ATSI) and did not meet the statewide exit criteria for these plans. Among all public schools, 10 percent were identified for CSI.
- States identify schools for targeted or additional targeted support and improvement (TSI/ATSI) if one or more student subgroups are “consistently underperforming” as defined by the state or if one or more student subgroups are performing as poorly as the lowest performing 5 percent of Title I schools identified for CSI. Among all public schools, 18 percent were identified for TSI/ATSI.
- Compared to the overall percentage of public schools that were identified for CSI or TSI/ATSI (29 percent), higher percentages of schools with the following characteristics were identified for CSI or TSI/ATSI:
- In high-poverty neighborhoods (44 percent)
- With a student body made up of 76 percent of more students of color (42 percent)
- In the West (40 percent)
- Lower percentages of schools with the following characteristics were identified for CSI or TSI/ATSI than the national percentage (29 percent):
- In the Midwest (21 percent)
- With a student body made up of 25 percent or fewer students of color (16 percent)
- Among the 29 percent of schools identified for CSI or TSI/ATSI, the top areas prioritized for improvement in their SIPs were related to:
- Curriculum, assessment, or instructional materials (CAIM) for English/language arts (68 percent)
- CAIM for math (65 percent)
- CAIM for special populations (e.g., English learners and students with disabilities) (56 percent)
- School climate and culture (46 percent)
- Family or community engagement (45 percent)
- Student engagement (42 percent)
The findings released today, which also include data on school lunch programs and school improvement plans, are part of an experimental data product from the School Pulse Panel, NCES’s innovative approach to delivering timely information regarding the COVID-19 pandemic’s impact on public K-12 schools in the U.S. The data, collected between November 14 and November 28 of 2023, came from 1,536 participating public K-12 schools from every state and the District of Columbia.
Experimental data products are innovative statistical tools created using new data sources or methodologies. Experimental data may not meet all of NCES’s quality standards but are of sufficient benefit to data users in the absence of other relevant products to justify release. NCES clearly identifies experimental data products upon their release.
All data released today can be found on the School Pulse Panel dashboard at https://nces.ed.gov/surveys/spp/results.asp.
The Institute of Education Sciences, a part of the U.S. Department of Education, is the nation’s leading source for rigorous, independent education research, evaluation, statistics, and assessment.
By visiting Newsflash you may also sign up to receive information from IES and its four Centers NCES, NCER, NCEE, & NCSER to stay abreast of all activities within the Institute of Education Sciences (IES).
No comments yet.
RSS feed for comments on this post. TrackBack URI
- SEO Powered Content & PR Distribution. Get Amplified Today.
- PlatoData.Network Vertical Generative Ai. Empower Yourself. Access Here.
- PlatoAiStream. Web3 Intelligence. Knowledge Amplified. Access Here.
- PlatoESG. Carbon, CleanTech, Energy, Environment, Solar, Waste Management. Access Here.
- PlatoHealth. Biotech and Clinical Trials Intelligence. Access Here.
- Source: https://virtualschooling.wordpress.com/2024/01/22/public-schools-leaders-report-90-percent-average-daily-student-attendance-rate-in-november-2023/
- :is
- :not
- $UP
- 09
- 1
- 10
- 14
- 15%
- 16
- 2023
- 22
- 23
- 25
- 26
- 27
- 28
- 29
- 300
- 35 percent
- 35%
- 40
- 41
- 46
- 52
- 65
- 7
- 8
- 90
- a
- ability
- About
- accountability
- Act
- activities
- Additional
- agriculture
- All
- also
- among
- an
- and
- any
- applications
- approach
- ARE
- areas
- Arts
- AS
- assessment
- At
- attendance
- average
- based
- BE
- begin
- being
- benefit
- between
- body
- but
- by
- came
- CAN
- Category
- Center
- challenges
- characteristics
- clearly
- Climate
- color
- Columbia
- comment
- comments
- community
- compared
- comprehensive
- Concern
- concerning
- Concerns
- Costs
- COVID-19
- created
- criteria
- CSI
- Culture
- daily
- dashboard
- data
- decrease
- defined
- delivering
- Department
- Devices
- DID
- disabilities
- district
- doing
- during
- e
- ed
- Education
- Electronic
- end
- engagement
- English
- estimate
- Ether (ETH)
- evaluation
- Every
- examine
- Exit
- experimental
- extreme
- facing
- failing
- Fall
- feedback
- fewer
- findings
- First
- following
- food
- food service
- For
- found
- four
- from
- graduate
- graph
- Group’s
- Have
- High
- higher
- How
- HTTPS
- i
- identified
- identifier
- identifies
- identify
- if
- Impact
- improvement
- in
- include
- independent
- information
- innovative
- Institute
- instructional
- interest
- into
- issue
- IT
- items
- ITS
- laptops
- Last
- latest
- leaders
- leading
- learners
- left
- lower
- lowest
- lunch
- made
- materials
- math
- May..
- meals
- Meet
- Meta
- methodologies
- Michael
- midwest
- more
- most
- National
- Nations
- Nationwide
- New
- November
- obtain
- of
- offering
- on
- ONE
- operating
- or
- Other
- overall
- panel
- parents
- part
- participating
- percent
- percentage
- performing
- plans
- plato
- Plato Data Intelligence
- PlatoData
- pm
- populations
- Post
- previously
- price
- prioritized
- procurement
- Product
- Products
- Program
- Programs
- public
- pulse
- quality
- Rate
- Rates
- readers
- really
- receive
- reduce
- regarding
- related
- release
- released
- Releases
- relevant
- report
- Reported
- Reporting
- requires
- research
- resource
- respectively
- rigorous
- round
- s
- School
- Schools
- SCIENCES
- secondary
- service
- Services
- shortages
- sign
- Simple
- site
- So
- some
- Source
- Sources
- Space
- spam
- special
- Staff
- standards
- State
- States
- statistical
- statistics
- stay
- Student
- Students
- submit
- sufficient
- supply
- support
- syndication
- system
- TAG
- targeted
- teacher
- teachers
- than
- that
- The
- The State
- The West
- their
- These
- they
- Third
- this
- three
- timely
- Title
- to
- today
- tools
- top
- Topics
- u.s.
- under
- United
- United States
- upon
- usda
- users
- uses
- using
- Versus
- was
- were
- West
- which
- with
- within
- WordPress
- year
- yet
- you
- Your
- zephyrnet