Image by Author
As a software developer, you’ll have likely heard the quote “Premature optimization is the root of all evil”—more than once—in your career. While optimization may not be super helpful (or absolutely necessary) for small projects, profiling is often helpful.
After you’ve finished coding a module, it’s a good practice to profile your code to measure how long each of the sections takes to execute. This can help identify code smells and guide optimizations to improve code quality. So always profile your code before optimizing!
To take the first steps, this guide will help you get started with profiling in Python—using the built-in timeit and cProfile modules. You’ll learn to use both the command-line interface and the equivalent callables inside Python scripts.
The timeit module is part of the Python standard library and offers a few convenience functions that can be used to time short snippets of code.
Let's take a simple example of reversing a Python list. We’ll measure the execution times of obtaining a reversed copy of the list using:
- the
reversed()function, and - list slicing.
>>> nums=[6,9,2,3,7]
>>> list(reversed(nums))
[7, 3, 2, 9, 6]
>>> nums[::-1]
[7, 3, 2, 9, 6]
Running timeit at the Command Line
You can run timeit at the command line using the syntax:
$ python -m timeit -s 'setup-code' -n 'number' -r 'repeat' 'stmt'
You’re required to provide the statement stmt whose execution time is to be measured.
You can specify the setup code when needed—using the short option -s or the long option --setup. The setup code will be run only once.
The number of times to run the statement: short option -n or the long option --number is optional. And the number of times to repeat this cycle: short option -r or the long option --repeat is optional, too.
Let’s see the above in action for our example:
Here creating the list is the setup code and reversing the list is the statement to be timed:
$ python -m timeit -s 'nums=[6,9,2,3,7]' 'list(reversed(nums))'
500000 loops, best of 5: 695 nsec per loop
When you don’t specify values for repeat, the default value of 5 is used. And when you don’t specify number, the code is run as many times as needed so as to reach a total time of at least 0.2 seconds.
This example explicitly sets the number of times to execute the statement:
$ python -m timeit -s 'nums=[6,9,2,3,7]' -n 100Bu000 'list(reversed(nums))'
100000 loops, best of 5: 540 nsec per loop
The default value of repeat is 5, but we can set it to any suitable value:
$ python3 -m timeit -s 'nums=[6,9,2,3,7]' -r 3 'list(reversed(nums))'
500000 loops, best of 3: 663 nsec per loop
Let’s also time the list slicing approach:
$ python3 -m timeit -s 'nums=[6,9,2,3,7]' 'nums[::-1]'
1000000 loops, best of 5: 142 nsec per loop
The list slicing approach seems to be faster (all examples are in Python 3.10 on Ubuntu 22.04).
Running timeit in a Python Script
Here’s the equivalent of running timeit inside the Python script:
import timeit setup = 'nums=[9,2,3,7,6]'
number = 100000
stmt1 = 'list(reversed(nums))'
stmt2 = 'nums[::-1]' t1 = timeit.timeit(setup=setup,stmt=stmt1,number=number)
t2 = timeit.timeit(setup=setup,stmt=stmt2,number=number) print(f"Using reversed() fn.: {t1}")
print(f"Using list slicing: {t2}")
The timeit() callable returns the execution time of stmt for number of times. Notice that we can explicitly mention the number of times to run, or make number take the default value of 1000000.
Output >>
Using reversed() fn.: 0.08982690000000002
Using list slicing: 0.015550800000000004
This runs the statement—without repeating the timer function—for the specified number of times and returns the execution time. It is also quite common to use time.repeat() and take the minimum time as shown:
import timeit setup = 'nums=[9,2,3,7,6]'
number = 100000
stmt1 = 'list(reversed(nums))'
stmt2 = 'nums[::-1]' t1 = min(timeit.repeat(setup=setup,stmt=stmt1,number=number))
t2 = min(timeit.repeat(setup=setup,stmt=stmt2,number=number)) print(f"Using reversed() fn.: {t1}")
print(f"Using list slicing: {t2}")
This will repeat the process of running the code number of times repeat number of times and returns the minimum execution time. Here we have 5 repetitions of 100000 times each.
Output >>
Using reversed() fn.: 0.055375300000000016
Using list slicing: 0.015101400000000043
We have seen how timeit can be used to measure the execution times of short code snippets. However, in practice, it's more helpful to profile an entire Python script.
This will give us the execution times of all the functions and method calls—including built-in functions and methods. So we can get a better idea of the more expensive function calls and identify opportunities for optimization. For example: there might be an API call that's too slow. Or a function may have a loop that can be replaced by a more Pythonic comprehension expression.
Let’s learn how to profile Python scripts using the cProfile module (also part of the Python standard library).
Consider the following Python script:
# main.py
import time def func(num): for i in range(num): print(i) def another_func(num): time.sleep(num) print(f"Slept for {num} seconds") def useful_func(nums, target): if target in nums: return nums.index(target) if __name__ == "__main__": func(1000) another_func(20) useful_func([2, 8, 12, 4], 12)
Here we have three functions:
func()that loops through a range of numbers and prints them out.another func()that contains a call to thesleep()function.useful_func()that returns the index of a target number in list (if the target is present in the list).
The above-listed functions will be called each time you run the main.py script.
Running cProfile at the Command Line
Run cProfile at the command line using:
python3 -m file-name.py
Here we’ve named the file main.py:
python3 -m main.py
Running this should give you the following output:
Output >> 0 ... 999 Slept for 20 seconds
And the following profile:
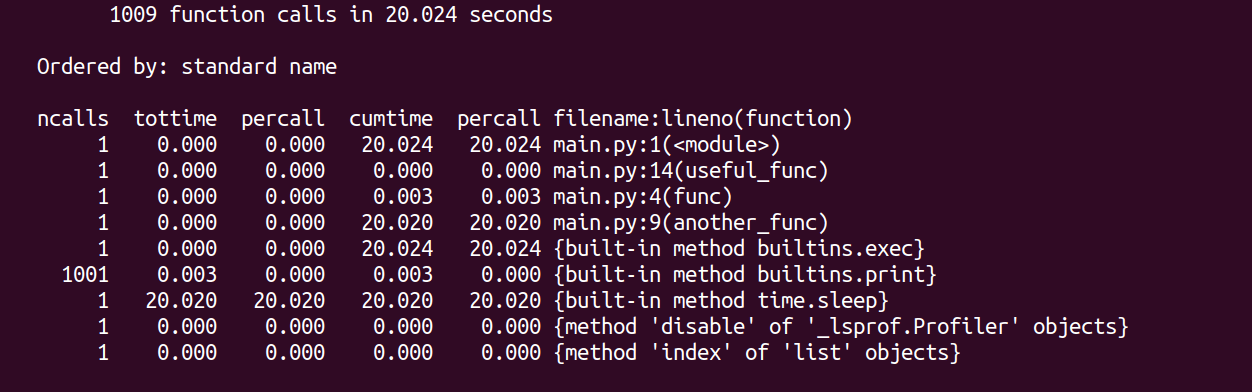
Here, ncalls refers to the number of calls to the function and percall refers to the time per function call. If the value of ncalls is greater than one, then percall is the average time across all calls.
The execution time of script is dominated by another_func that uses the built-in sleep function call (sleeps for 20 seconds). We see that print function calls are quite expensive too.
Using cProfile in the Python Script
While running cProfile at the command line works fine, you can also add the profiling functionality to the Python script. You can use cProfile coupled with the pstats module for profiling and accessing statistics.
As a best practice to handle resource setup and teardown better, use the with statement and create a profile object that’s used as a context manager:
# main.py
import pstats
import time
import cProfile def func(num): for i in range(num): print(i) def another_func(num): time.sleep(num) print(f"Slept for {num} seconds") def useful_func(nums, target): if target in nums: return nums.index(target) if __name__ == "__main__": with cProfile.Profile() as profile: func(1000) another_func(20) useful_func([2, 8, 12, 4], 12) profile_result = pstats.Stats(profile) profile_result.print_stats()
Let’s take a closer look at the output profile generated:
When you’re profiling a large script, it’ll be helpful to sort the results by execution time. To do so you can call sort_stats on the profile object and sort based on the execution time:
...
if __name__ == "__main__": with cProfile.Profile() as profile: func(1000) another_func(20) useful_func([2, 8, 12, 4], 12) profile_result = pstats.Stats(profile) profile_result.sort_stats(pstats.SortKey.TIME) profile_result.print_stats()
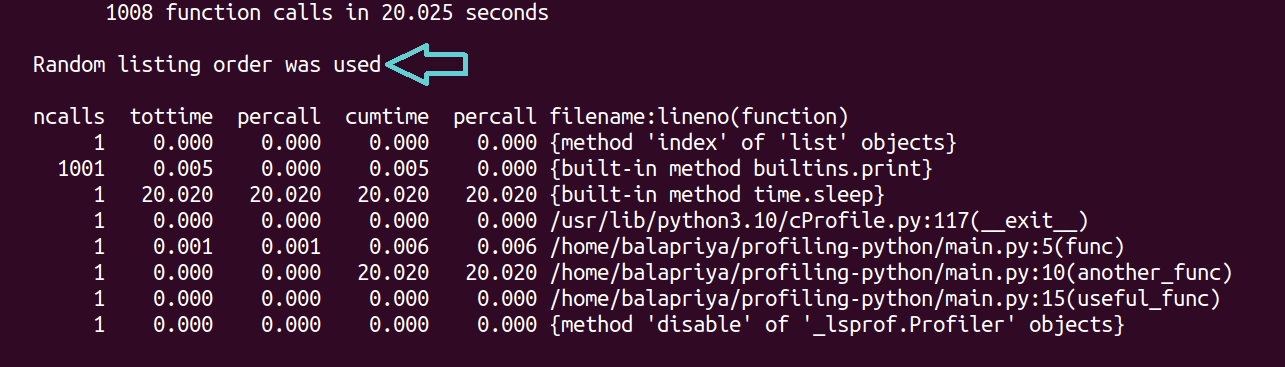
When you now run the script, you should be able to see the results sorted by time:

I hope this guide helps you get started with profiling in Python. Always remember, optimizations should never come at the cost of readability. If you’re interested in learning about other profilers, including third-party Python packages, check out this article on Python profilers.
Bala Priya C is a developer and technical writer from India. She likes working at the intersection of math, programming, data science, and content creation. Her areas of interest and expertise include DevOps, data science, and natural language processing. She enjoys reading, writing, coding, and coffee! Currently, she's working on learning and sharing her knowledge with the developer community by authoring tutorials, how-to guides, opinion pieces, and more.
- SEO Powered Content & PR Distribution. Get Amplified Today.
- PlatoData.Network Vertical Generative Ai. Empower Yourself. Access Here.
- PlatoAiStream. Web3 Intelligence. Knowledge Amplified. Access Here.
- PlatoESG. Automotive / EVs, Carbon, CleanTech, Energy, Environment, Solar, Waste Management. Access Here.
- PlatoHealth. Biotech and Clinical Trials Intelligence. Access Here.
- ChartPrime. Elevate your Trading Game with ChartPrime. Access Here.
- BlockOffsets. Modernizing Environmental Offset Ownership. Access Here.
- Source: https://www.kdnuggets.com/profiling-python-code-using-timeit-and-cprofile?utm_source=rss&utm_medium=rss&utm_campaign=profiling-python-code-using-timeit-and-cprofile
- :is
- :not
- 10
- 100000
- 12
- 13
- 15%
- 17
- 19
- 20
- 22
- 7
- 8
- 9
- a
- Able
- About
- above
- absolutely
- accessing
- ACM
- across
- Action
- add
- All
- also
- always
- an
- and
- any
- api
- approach
- ARE
- areas
- AS
- At
- authoring
- average
- based
- BE
- before
- BEST
- Better
- both
- built-in
- but
- by
- call
- called
- Calls
- CAN
- Can Get
- Career
- CFM
- check
- closer
- code
- Coding
- come
- Common
- community
- contains
- content
- content-creation
- context
- convenience
- Cost
- coupled
- create
- Creating
- creation
- Currently
- cycle
- data
- data science
- Default
- Developer
- DevOps
- do
- Dont
- each
- Entire
- Equivalent
- example
- examples
- execute
- execution
- expensive
- expertise
- expression
- faster
- few
- File
- fine
- First
- first steps
- following
- For
- from
- function
- functionality
- functions
- generated
- get
- Give
- good
- greater
- guide
- Guides
- handle
- Have
- heard
- help
- helpful
- helps
- her
- here
- hope
- How
- How To
- However
- HTML
- HTTPS
- i
- idea
- identify
- if
- import
- improve
- in
- include
- Including
- index
- india
- inside
- interest
- interested
- Interface
- intersection
- IT
- KDnuggets
- knowledge
- language
- large
- LEARN
- learning
- least
- Library
- likely
- likes
- Line
- List
- Long
- Look
- Main
- make
- manager
- many
- math
- May..
- measure
- measured
- mention
- method
- methods
- might
- minimum
- module
- Modules
- more
- Named
- Natural
- Natural Language
- Natural Language Processing
- necessary
- needed
- never
- Notice..
- now
- number
- numbers
- object
- obtaining
- of
- Offers
- often
- on
- once
- ONE
- only
- Opinion
- opportunities
- optimization
- Option
- or
- Other
- our
- out
- output
- packages
- part
- per
- pieces
- plato
- Plato Data Intelligence
- PlatoData
- practice
- present
- prints
- process
- processing
- Profile
- profiling
- Programming
- projects
- provide
- Python
- quality
- quote
- range
- reach
- Reading
- refers
- remember
- repeat
- replaced
- required
- resource
- Results
- return
- returns
- root
- Run
- running
- runs
- s
- Science
- script
- scripts
- seconds
- sections
- see
- seems
- seen
- set
- Sets
- setup
- sharing
- she
- Short
- should
- shown
- Simple
- slow
- small
- So
- Software
- specified
- standard
- started
- Statement
- statistics
- Steps
- suitable
- Super
- syntax
- T1
- Take
- takes
- Target
- teardown
- Technical
- than
- that
- The
- Them
- then
- There.
- third-party
- this
- three
- Through
- time
- Timed
- times
- to
- too
- Total
- tutorials
- Ubuntu
- us
- use
- used
- uses
- using
- value
- Values
- we
- when
- while
- whose
- will
- with
- working
- works
- writer
- writing
- you
- Your
- zephyrnet