Polygon (MATIC) has been experiencing a mix of price action, with a 24-hour rally of 3.5% that hints at potential positive movement. However, the coin has suffered a 4.4% slump over the past seven days, indicating underlying bearish sentiments in the market.
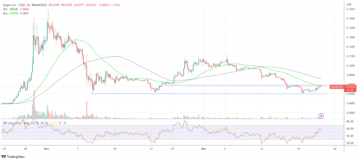
Despite the short-term surge, the weekly time frame presents a negative outlook, primarily due to the failure to break through a long-term horizontal resistance.
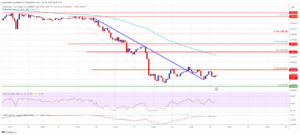
Adding to the bearish pressure, an ascending trendline has been broken, signaling a potential further decline in MATIC’s price.

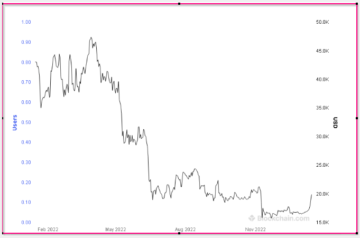
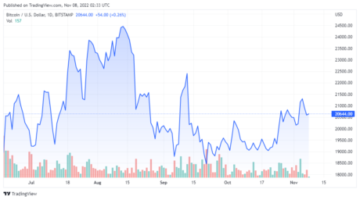
Source: Coingecko
One of the significant factors contributing to MATIC’s current bearish scenario is its inability to surpass the significant resistance zone of around $0.80.
This area had been acting as a strong support level for the altcoin, providing stability during various price fluctuations. However, this support became a formidable resistance over the past two weeks, thwarting MATIC’s attempts to climb higher.
Polygon (MATIC) Ascending Trendline Breakdown
An ascending trendline is a sloping line that connects a series of ascending lows in an uptrend. It represents a rising level of support and is often used to gauge the strength of a bullish trend.
The breakdown of this trendline indicates a shift in sentiment, suggesting that buyers are losing control and sellers are gaining momentum.
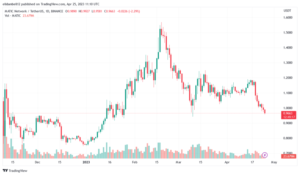
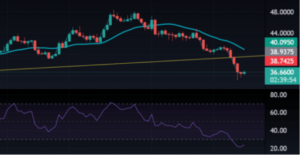
MATIC market cap currently at $6.8 billion. Chart: TradingView.com
The breakdown of the ascending trendline sets the stage for a potential 22% drop in MATIC’s price. If the coin fails to find strong support at lower levels, this decline could be the next crucial movement for the cryptocurrency.
Traders and investors must closely monitor price action to determine if MATIC can stabilize or if further losses are on the horizon.
Bear Trap Scenario And Bullish Recovery
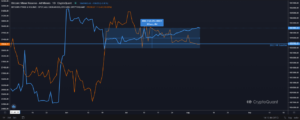
However, there is a glimmer of hope for MATIC’s price trajectory. If buyers can push the current price above $0.729221, it could invalidate the recent bearish breakdown.
This move could create a bear trap scenario, where traders anticipating a continued decline may be forced to cover their short positions, leading to a sudden surge in buying activity. If this scenario plays out, it could assist MATIC in initiating a bullish recovery.
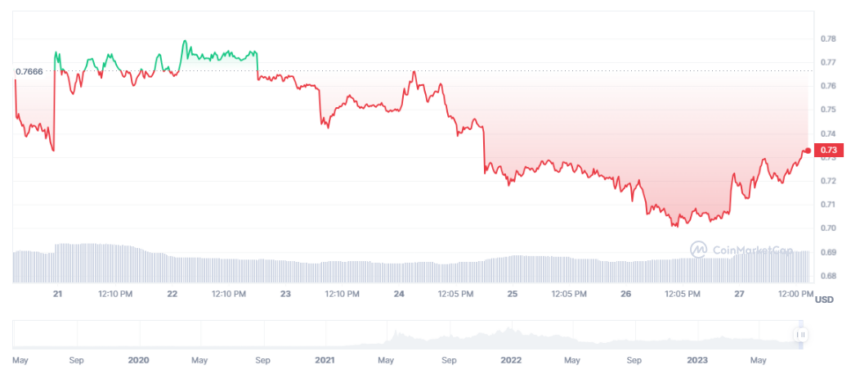
MATIC price movement in the last week. Source: CoinMarketCap
As an observer of the cryptocurrency market, it’s essential to acknowledge that the price of the MATIC token and other digital assets can be highly volatile and subject to various technical and fundamental factors.
While the current price action may raise concerns for some investors, it’s essential to remember that market conditions can change rapidly.
(This site’s content should not be construed as investment advice. Investing involves risk. When you invest, your capital is subject to risk).
Featured image from CoinChapter
- SEO Powered Content & PR Distribution. Get Amplified Today.
- PlatoData.Network Vertical Generative Ai. Empower Yourself. Access Here.
- PlatoAiStream. Web3 Intelligence. Knowledge Amplified. Access Here.
- PlatoESG. Automotive / EVs, Carbon, CleanTech, Energy, Environment, Solar, Waste Management. Access Here.
- BlockOffsets. Modernizing Environmental Offset Ownership. Access Here.
- Source: https://www.newsbtc.com/news/polygon-warning-signs-point-to-a-slide/
- :has
- :is
- :not
- :where
- 8
- a
- above
- acknowledge
- acting
- Action
- activity
- advice
- Altcoin
- an
- and
- anticipating
- ARE
- AREA
- around
- AS
- Assets
- assist
- At
- Attempts
- BE
- Bear
- bearish
- became
- been
- Billion
- Break
- Breakdown
- Broken
- Bullish
- buyers
- Buying
- CAN
- cap
- capital
- change
- Chart
- climb
- closely
- Coin
- CoinGecko
- Concerns
- conditions
- connects
- content
- continued
- contributing
- control
- could
- cover
- create
- crucial
- cryptocurrency
- cryptocurrency market
- Current
- Currently
- Days
- Decline
- Determine
- digital
- Digital Assets
- Drop
- due
- during
- essential
- experiencing
- factors
- fails
- Failure
- Find
- fluctuations
- For
- formidable
- FRAME
- from
- fundamental
- further
- gaining
- gauge
- glimmer
- had
- higher
- highly
- hints
- hope
- horizon
- Horizontal
- However
- HTTPS
- if
- image
- in
- inability
- indicates
- indicating
- initiating
- Invest
- investing
- investment
- Investors
- IT
- ITS
- Last
- leading
- Level
- levels
- Line
- long-term
- losing
- losses
- lower
- Lows
- Market
- Market Cap
- market conditions
- Matic
- MATIC price
- max-width
- May..
- mix
- Momentum
- Monitor
- move
- movement
- must
- negative
- NewsBTC
- next
- of
- often
- on
- or
- Other
- out
- Outlook
- over
- past
- plato
- Plato Data Intelligence
- PlatoData
- plays
- Point
- Polygon
- positions
- positive
- potential
- presents
- pressure
- price
- PRICE ACTION
- Price Fluctuations
- primarily
- providing
- Push
- raise
- rally
- rapidly
- recent
- recovery
- remember
- represents
- Resistance
- rising
- Risk
- scenario
- Sellers
- sentiment
- Series
- Sets
- seven
- shift
- Short
- short-term
- should
- significant
- Signs
- Slide
- Slump
- some
- Source
- Stability
- stabilize
- Stage
- strength
- strong
- subject
- sudden
- support
- support level
- surge
- surpass
- Technical
- that
- The
- The Weekly
- their
- There.
- this
- Through
- time
- to
- token
- Traders
- TradingView
- trajectory
- Trend
- true
- two
- underlying
- uptrend
- used
- various
- volatile
- warning
- week
- weekly
- Weeks
- when
- with
- you
- Your
- zephyrnet