Image by Editor
Key Takeaways
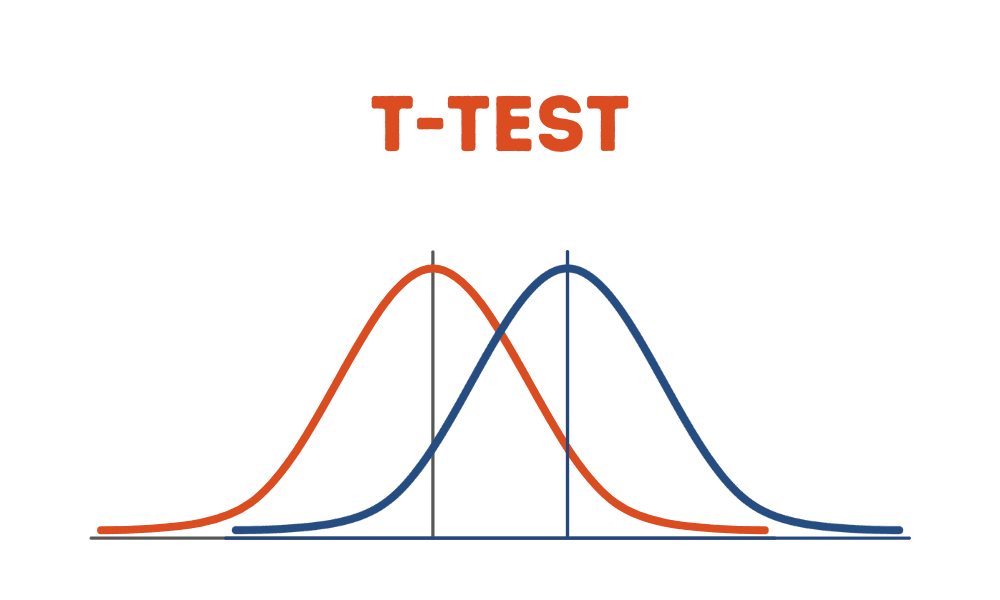
- The t-test is a statistical test that can be used to determine if there is a significant difference between the means of two independent samples of data.
- We illustrate how a t-test can be applied using the iris dataset and Python’s Scipy library.
The t-test is a statistical test that can be used to determine if there is a significant difference between the means of two independent samples of data. In this tutorial, we illustrate the most basic version of the t-test, for which we will assume that the two samples have equal variances. Other advanced versions of the t-test include the Welch’s t-test, which is an adaptation of the t-test, and is more reliable when the two samples have unequal variances and possibly unequal sample sizes.
The t statistic or t-value is calculated as follows:
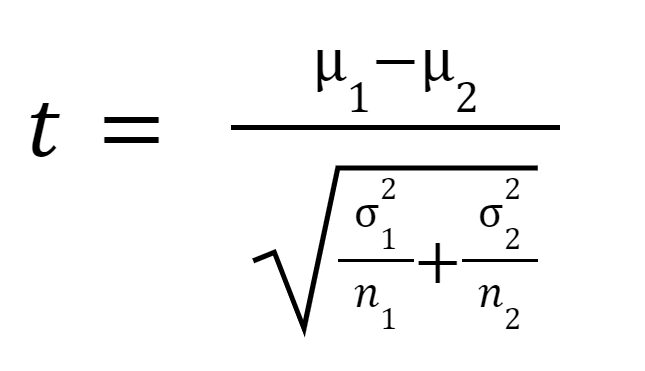
where
is the mean of sample 1,
is the mean of sample 2,
 is the variance of sample 1,
  is the variance of sample 2,
  is the sample size of sample 1, and
  is the sample size of sample 2.
To illustrate the use of the t-test, we will show a simple example using the iris dataset. Suppose we observe two independent samples, e.g. flower sepal lengths, and we are considering whether the two samples were drawn from the same population (e.g. the same species of flower or two species with similar sepal characteristics) or two different populations.
The t-test quantifies the difference between the arithmetic means of the two samples. The p-value quantifies the probability of obtaining the observed results, assuming the null hypothesis (that the samples are drawn from populations with the same population means) is true. A p-value larger than a chosen threshold (e.g. 5% or 0.05) indicates that our observation is not so unlikely to have occurred by chance. Therefore, we accept the null hypothesis of equal population means. If the p-value is smaller than our threshold, then we have evidence against the null hypothesis of equal population means.
T-Test Input
The inputs or parameters necessary for performing a t-test are:
- Two arrays a and b containing the data for sample 1 and sample 2
T-Test Outputs
The t-test returns the following:
- The calculated t-statistics
- The p-value
Import necessary libraries
import numpy as np
from scipy import stats import matplotlib.pyplot as plt
from sklearn.model_selection import train_test_split
Load Iris Dataset
from sklearn import datasets
iris = datasets.load_iris()
sep_length = iris.data[:,0]
a_1, a_2 = train_test_split(sep_length, test_size=0.4, random_state=0)
b_1, b_2 = train_test_split(sep_length, test_size=0.4, random_state=1)
Calculate the sample means and sample variances
mu1 = np.mean(a_1) mu2 = np.mean(b_1) np.std(a_1) np.std(b_1)
Implement t-test
stats.ttest_ind(a_1, b_1, equal_var = False)
Output
Ttest_indResult(statistic=0.830066093774641, pvalue=0.4076270841218671)
stats.ttest_ind(b_1, a_1, equal_var=False)
Output
Ttest_indResult(statistic=-0.830066093774641, pvalue=0.4076270841218671)
stats.ttest_ind(a_1, b_1, equal_var=True)
Output
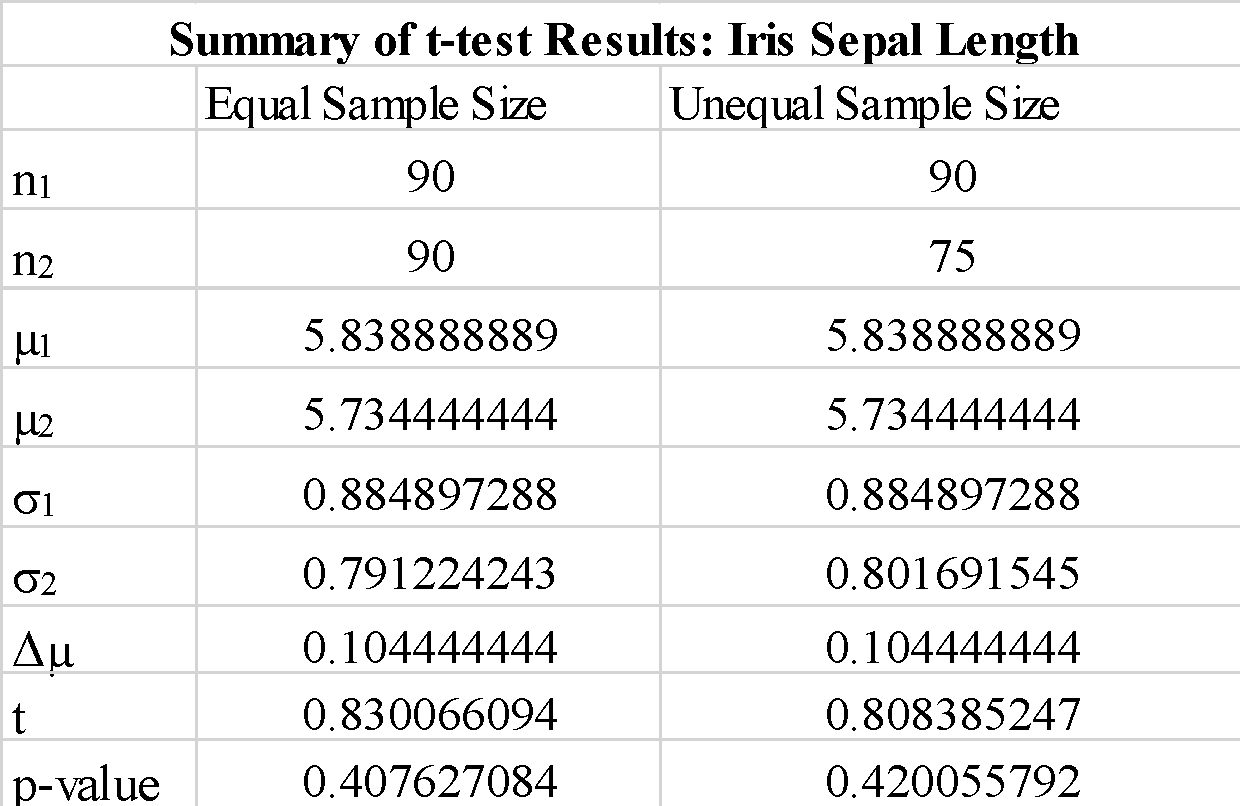
Ttest_indResult(statistic=0.830066093774641, pvalue=0.4076132965045395)Observations
We observe that the using “true” or “false” for the “equal-var” parameter does not change the t-test results that much. We also observe that interchanging the order of the sample arrays a_1 and b_1 yields a negative t-test value, but does not change the magnitude of the t-test value, as expected. Since the calculated p-value is way larger than the threshold value of 0.05, we can reject the null hypothesis that the difference between the means of sample 1 and sample 2 are significant. This shows that the sepal lengths for sample 1 and sample 2 were drawn from same population data.
a_1, a_2 = train_test_split(sep_length, test_size=0.4, random_state=0)
b_1, b_2 = train_test_split(sep_length, test_size=0.5, random_state=1)
Calculate the sample means and sample variances
mu1 = np.mean(a_1) mu2 = np.mean(b_1) np.std(a_1) np.std(b_1)
Implement t-test
stats.ttest_ind(a_1, b_1, equal_var = False)
Output
stats.ttest_ind(a_1, b_1, equal_var = False)Observations
We observe that using samples with unequal size does not change the t-statistics and p-value significantly.
In summary, we’ve shown how a simple t-test could be implemented using the scipy library in python.
Benjamin O. Tayo is a Physicist, Data Science Educator, and Writer, as well as the Owner of DataScienceHub. Previously, Benjamin was teaching Engineering and Physics at U. of Central Oklahoma, Grand Canyon U., and Pittsburgh State U.
- SEO Powered Content & PR Distribution. Get Amplified Today.
- Platoblockchain. Web3 Metaverse Intelligence. Knowledge Amplified. Access Here.
- Source: https://www.kdnuggets.com/2023/01/performing-ttest-python.html?utm_source=rss&utm_medium=rss&utm_campaign=performing-a-t-test-in-python
- 1
- 7
- 9
- a
- Accept
- advanced
- against
- and
- applied
- basic
- Benjamin
- between
- calculated
- central
- Chance
- change
- characteristics
- chosen
- considering
- could
- data
- data science
- datasets
- Determine
- difference
- different
- drawn
- Engineering
- evidence
- example
- expected
- flower
- following
- follows
- from
- How
- HTTPS
- implemented
- import
- in
- include
- independent
- indicates
- KDnuggets
- larger
- Library
- matplotlib
- means
- more
- most
- necessary
- negative
- numpy
- observe
- obtaining
- occurred
- Oklahoma
- order
- Other
- owner
- parameter
- parameters
- performing
- Physics
- pittsburgh
- plato
- Plato Data Intelligence
- PlatoData
- population
- populations
- previously
- probability
- Python
- reliable
- Results
- returns
- same
- Science
- show
- shown
- Shows
- significant
- significantly
- similar
- Simple
- since
- Size
- sizes
- smaller
- So
- State
- statistical
- stats
- SUMMARY
- Teaching
- test
- The
- therefore
- threshold
- to
- true
- tutorial
- use
- value
- version
- whether
- which
- will
- writer
- yields
- zephyrnet