SNEAK PEEK
- Pepe (PEPE) surges as bullish momentum, but bears threaten key support levels.
- PEPE witnesses a resurgence of bullish momentum, leading to soaring prices.
- PEPE stands firm as buying pressure overwhelms sellers.
Breaking free from its recent slump, Pepe (PEPE) has witnessed a resurgence of bullish momentum, rekindling investors’ spirits. The market found solid support at $0.00000149, serving as a springboard for its upward trajectory in the past 24 hours. However, caution looms as bears threaten to breach this level, setting their sights on the next support at $0.00000145. Should the bears prevail, the price could test the resilience of the $0.00000140 support level.
Conversely, if the bullish trend continues unabated, shattering the shackles of resistance, attention turns to the pivotal $0.000001541 resistance level. A successful breach of this obstacle would open the gateway to further gains, with the next resistance eagerly awaiting at $0.00000160.
Back in $PEPE
Long it with me here ➡️ https://t.co/32dHnZIFxS pic.twitter.com/dYGOoeqW7b
— K A L E O (@CryptoKaleo) July 12, 2023
A pseudonymous crypto analyst named KALEO also echoed these positive sentiments. He foresees another bull run for the meme coin, PEPE. According to his analysis, PEPE might follow the pattern it set previously when two descending triangles had formed, leading to a drastic rise.
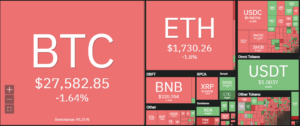
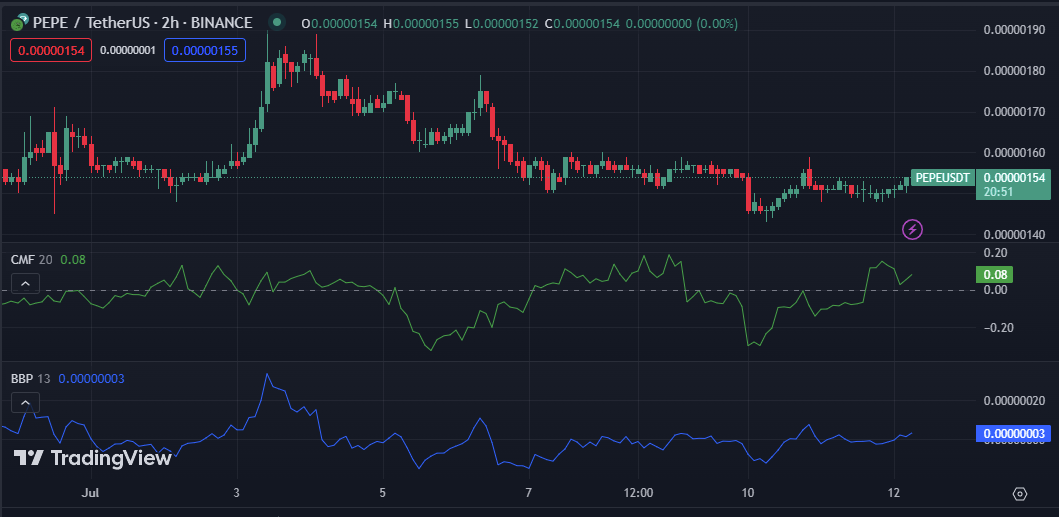
During writing, PEPE’s price had risen 1.16 % to $0.00000154. The market capitalization of PEPE increased by 1.33 %, reaching $604,985,151. This growth suggests investors perceive the token’s long-term potential despite recent price fluctuations. Despite a minor decrease of 29.52% in 24-hour trading volume to $79,289,889, the overall market sentiment remains positive.
The Relative Strength Index reading of 58.60 on the price chart for PEPE indicates that buying pressure is more significant than selling pressure. As long as purchasing pressure exceeds selling pressure, the price of PEPE may continue to rise on the back of bullish momentum. Nonetheless, if the RSI rises above the overbought threshold of 70, it may indicate that the price has become overvalued, and a reversal may be imminent.
The MACD blue line rises in the positive zone with a value of 0.00000001 above its signal line, contributing to the bullish trend. This movement suggests that bullish momentum is gaining strength and may persist. The favorable trend is reinforced by the presence of the histogram on the positive side.
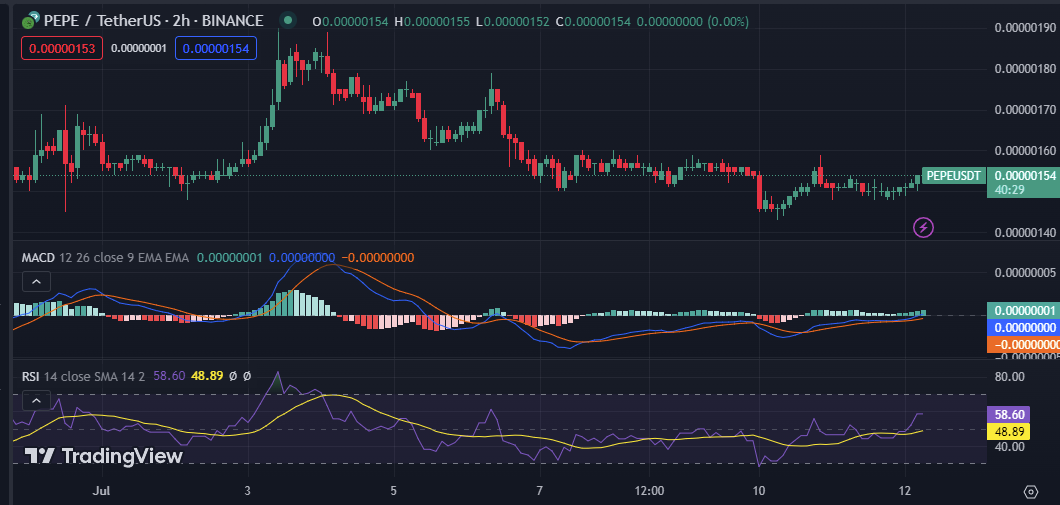
On the 2-hour price chart for PEPE, a Chaikin Money Flow (CMF) value of 0.08 supports the increasing buying pressure, indicating a positive outlook. This CMF rating and positive trend suggest that liquidity is entering the market, an encouraging indicator for investors.
The Bull Bear Power (BBP) is positive with a value of 0.00000003, indicating that buyers are currently controlling the market and pushing higher prices. If the Bull Bear Power indicator remains positive, it may suggest that the favorable momentum will persist, resulting in further price appreciation.
Nonetheless, if bears recover a portion of their losses and the BBP indicator falls into negative territory, this could signal a shift in market sentiment and a potential price trend reversal.
In conclusion, PEPE rises after a recent slump as bullish momentum surges. Bears threaten support levels, setting the stage for a crucial market battle to determine the next price direction.
Disclaimer: Cryptocurrency price is highly speculative and volatile and should not be considered financial advice. Past and current performance is not indicative of future results. Always research and consult with a financial advisor before making investment decisions.
- SEO Powered Content & PR Distribution. Get Amplified Today.
- PlatoData.Network Vertical Generative Ai. Empower Yourself. Access Here.
- PlatoAiStream. Web3 Intelligence. Knowledge Amplified. Access Here.
- PlatoESG. Automotive / EVs, Carbon, CleanTech, Energy, Environment, Solar, Waste Management. Access Here.
- BlockOffsets. Modernizing Environmental Offset Ownership. Access Here.
- Source: https://investorbites.com/pepe-price-analysis-12-07/
- :has
- :is
- :not
- 1
- 12
- 16
- 22
- 24
- 33
- 60
- 70
- a
- above
- According
- advice
- advisor
- After
- also
- always
- an
- analysis
- analyst
- and
- Another
- appreciation
- ARE
- AS
- At
- attention
- awaiting
- back
- Battle
- BE
- Bear
- Bears
- become
- before
- Blue
- breach
- breaks
- bull
- Bull Run
- Bullish
- Bulls
- but
- buyers
- Buying
- by
- capitalization
- caution
- Center
- Chart
- Clash
- Coin
- conclusion
- considered
- continue
- contributing
- controlling
- could
- crucial
- crypto
- crypto analyst
- Current
- Currently
- decisions
- decrease
- Despite
- Determine
- direction
- e
- eagerly
- encouraging
- entering
- exceeds
- external
- Falls
- favorable
- financial
- financial advice
- Firm
- flow
- fluctuations
- follow
- For
- For Investors
- formed
- found
- Free
- from
- further
- future
- gaining
- Gains
- gateway
- Growth
- had
- he
- here
- higher
- highly
- his
- HOURS
- However
- HTTPS
- if
- in
- increased
- increasing
- index
- indicate
- indicates
- indicating
- indicative
- Indicator
- internal
- into
- investment
- investor
- Investors
- IT
- ITS
- Kaleo
- Key
- leading
- Level
- levels
- Line
- Liquidity
- Long
- long-term
- losses
- MACD
- Making
- Market
- Market Capitalization
- Market News
- market sentiment
- May..
- me
- meme
- meme coin
- might
- minor
- Momentum
- money
- more
- movement
- Named
- negative
- negative territory
- news
- next
- obstacle
- of
- on
- open
- Outlook
- overall
- past
- Pattern
- pepe
- performance
- pivotal
- plato
- Plato Data Intelligence
- PlatoData
- positive
- potential
- power
- presence
- pressure
- previously
- price
- Price Analysis
- price chart
- Price Fluctuations
- Prices
- purchasing
- Pushing
- rating
- reaching
- Reading
- recent
- Recover
- relative
- relative strength index
- remains
- research
- resilience
- Resistance
- resulting
- Results
- Reversal
- Rise
- Risen
- Rises
- rsi
- Run
- Sellers
- Selling
- sentiment
- serving
- set
- setting
- shift
- should
- side
- Sights
- Signal
- significant
- Slump
- soaring
- solid
- Source
- speculative
- Stage
- stands
- strength
- successful
- suggest
- Suggests
- support
- support level
- support levels
- Supports
- Surges
- territory
- test
- than
- that
- The
- their
- These
- this
- threaten
- threshold
- to
- Trading
- trading volume
- TradingView
- trajectory
- Trend
- turns
- two
- upward
- value
- volatile
- volume
- when
- will
- with
- witnessed
- would
- writing
- zephyrnet