Chainlink (LINK) is following an ascending support line and has bounced at a horizontal support area.
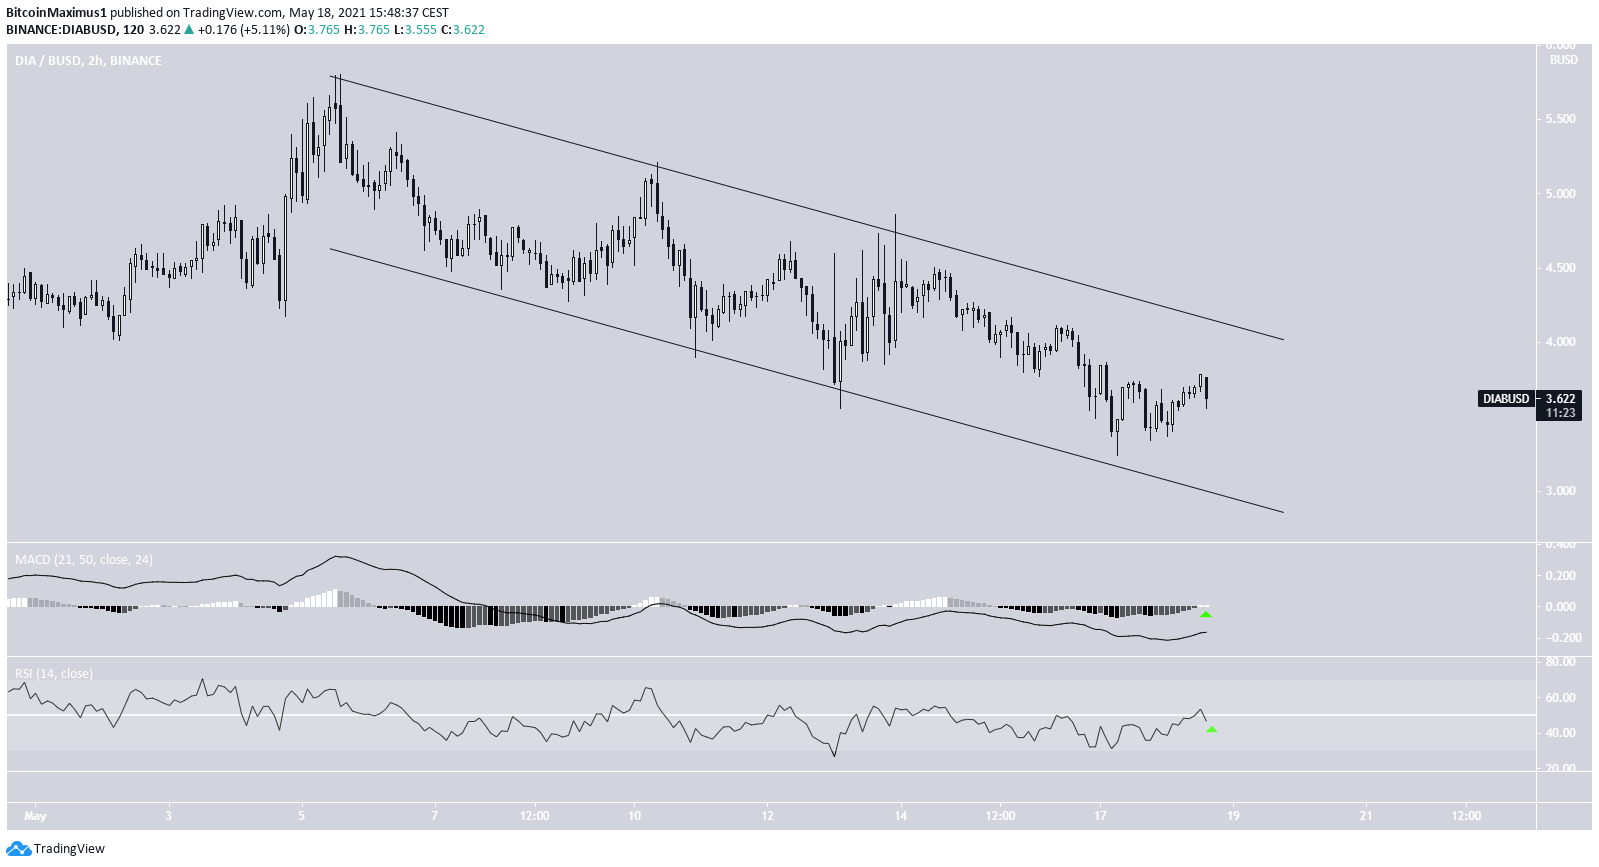
DIA (DIA) has returned to an ascending support line that has been in place since January 2021.
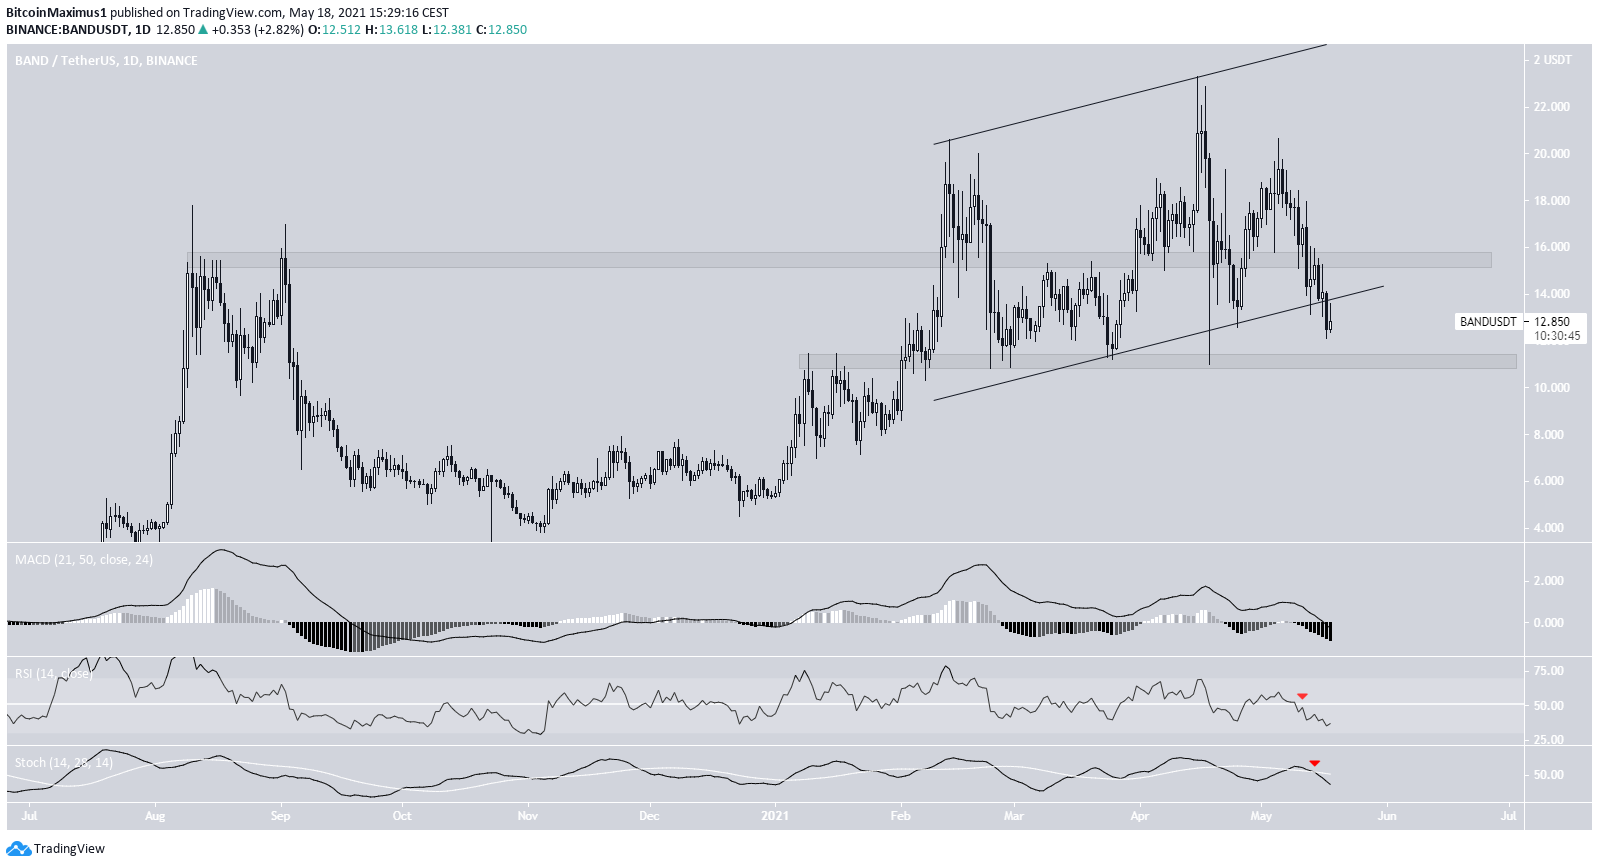
Band Protocol (BAND) has fallen below the $15.50 area and is at risk of breaking down from an ascending parallel channel.
LINK
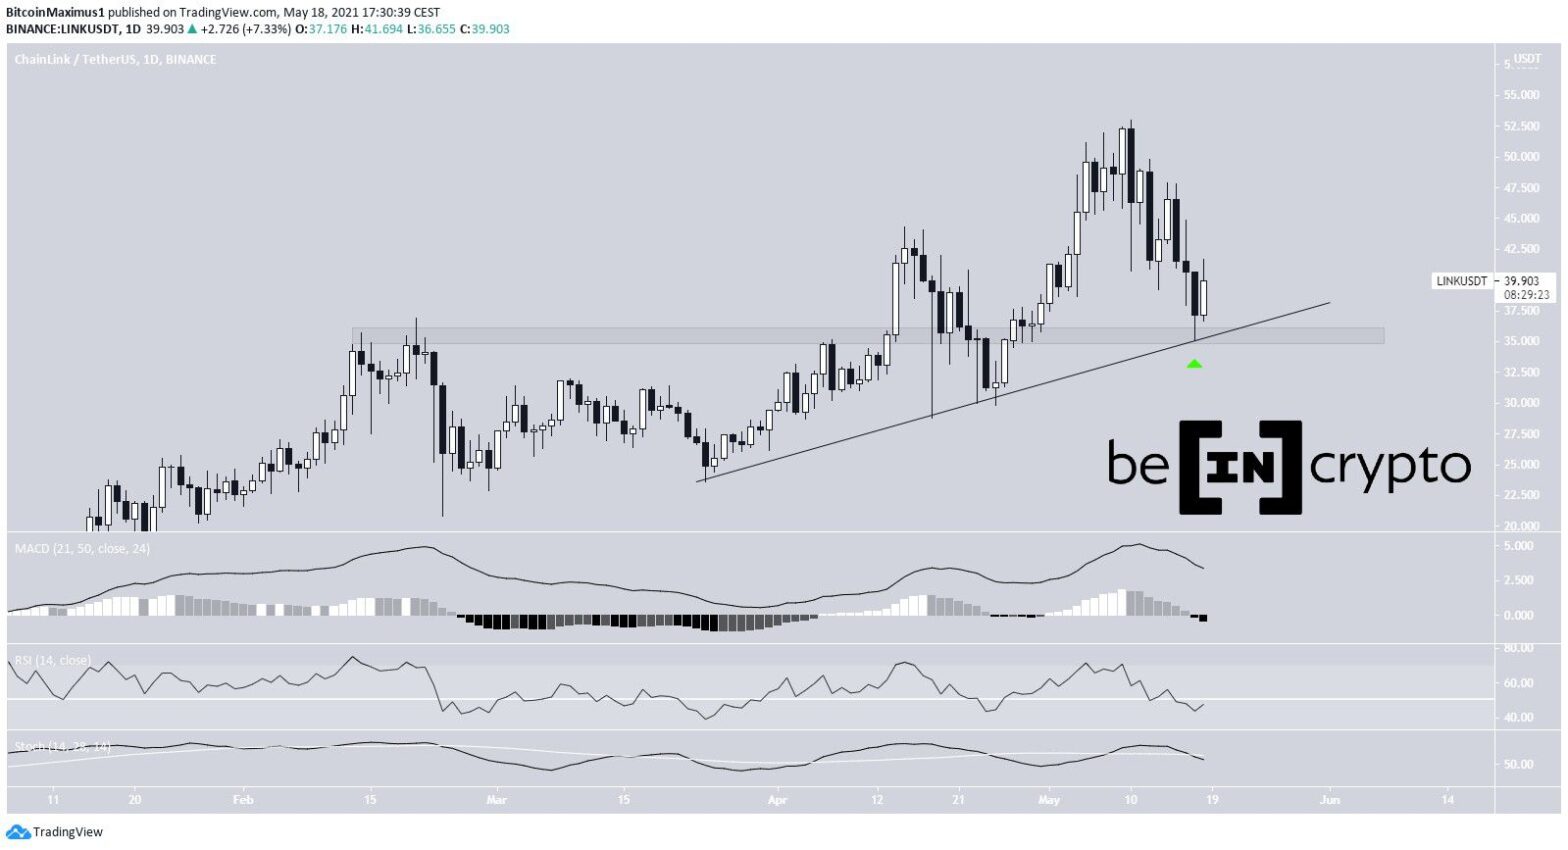
LINK has been moving downwards since May 10, when it reached an all-time high price of $53. It fell all the way to the $35.50 support area and bounced (green arrow). The area also coincides with an ascending support line in place since March 20.
Despite the bounce, technical indicators are bearish. The RSI has crossed below 50. The MACD is negative. The Stochastic Oscillator is decreasing.

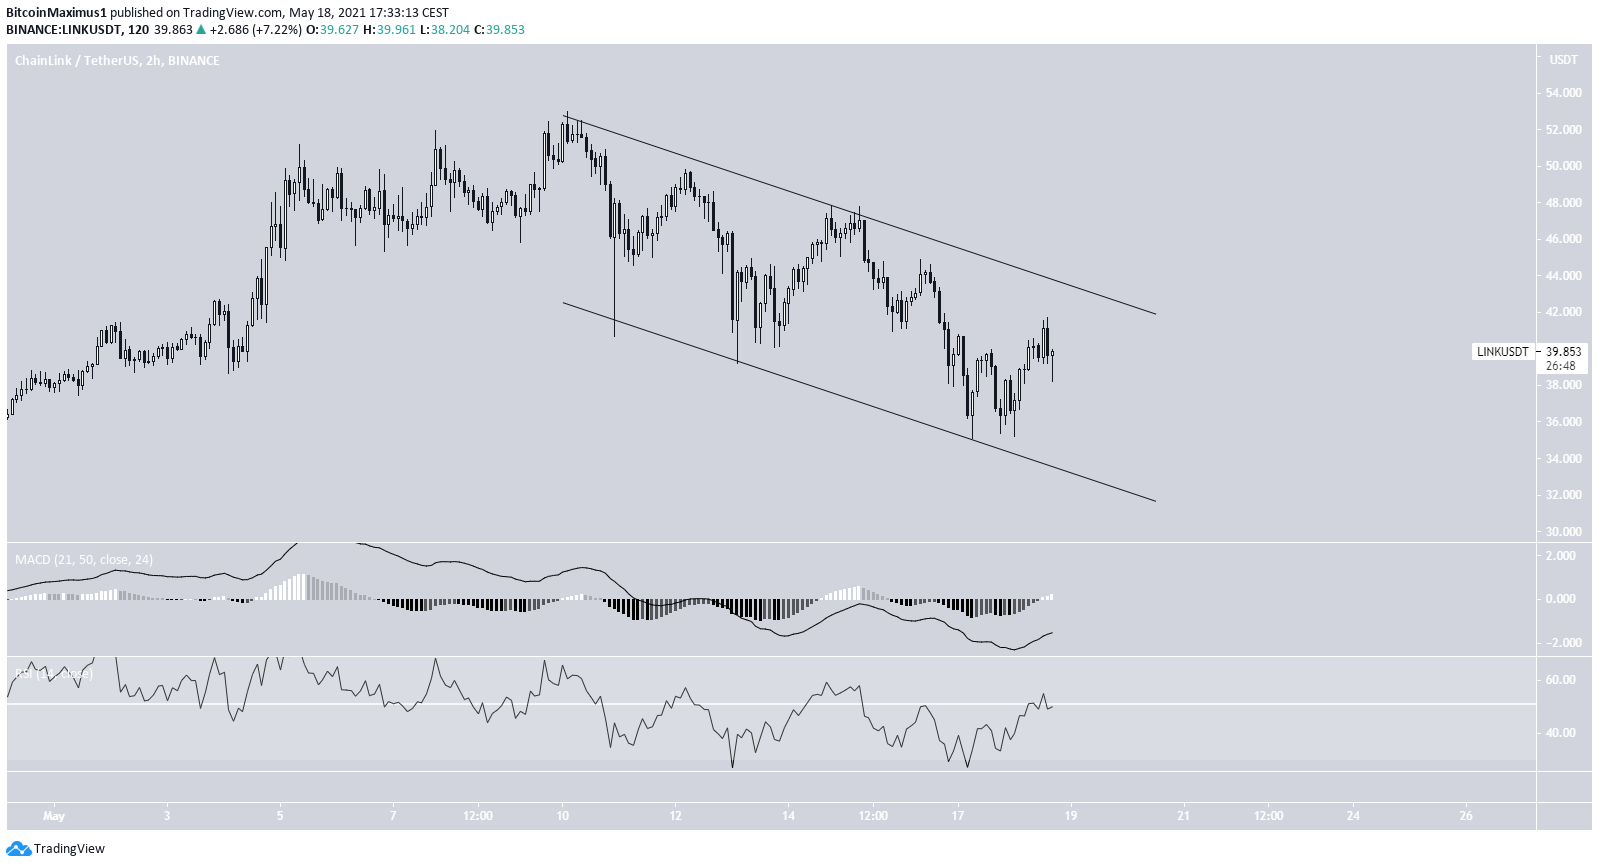
Nevertheless, the shorter-term two-hour chart is more bullish. LINK is trading inside a descending parallel channel, which is often a corrective movement. In addition, both the RSI and MACD are bullish.
Therefore, a breakout from the short-term channel is expected, despite the bearishness from the daily time-frame.
Highlights
- LINK has bounced at the $35.50 support area.
- It is following an ascending support line.
DIA
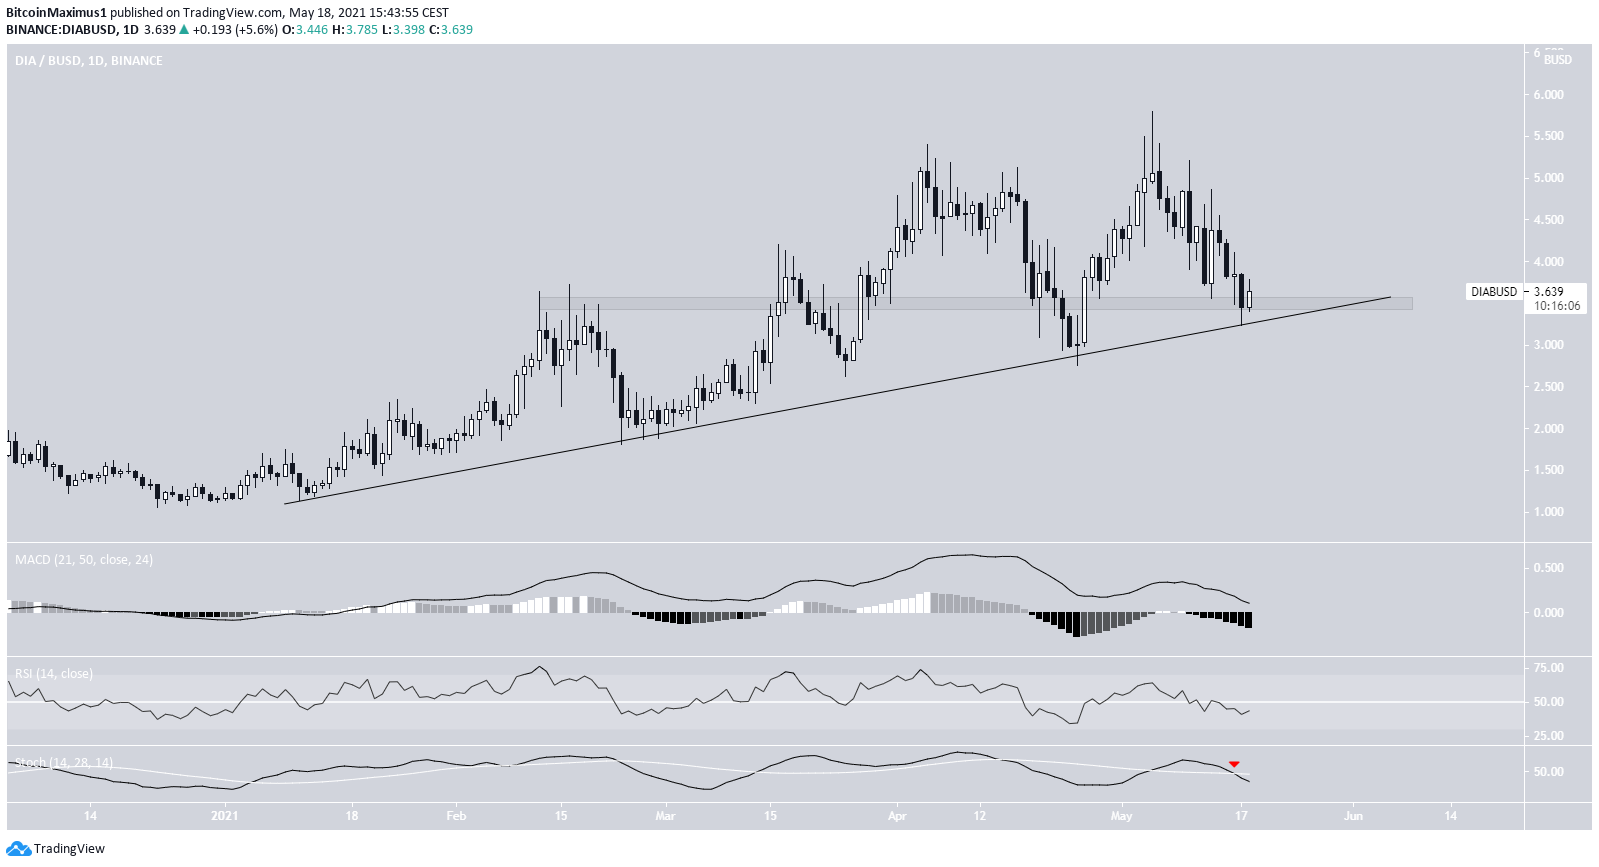
DIA has been decreasing since May 5, when it reached an all-time high price of $5.80 and created a shooting star candlestick.
DIA fell all the way to the $3.50 area, which has intermittently acted as both support and resistance. In addition, it has reached an ascending support line in place since January 2021.
Despite this, technical indicators are bearish. This is especially evident by the bearish cross in the Stochastic Oscillator (red arrow).
Similarly to LINK, the shorter-term two-hour chart is more bullish. It shows a descending parallel channel in place since the aforementioned all-time high price.
This is often a corrective movement that is followed by a breakout.
Furthermore, both the RSI and MACD are bullish.
Therefore, while the longer-term trend is undecided, a short-term breakout is likely.
Highlights
- DIA is following an ascending support line.
- It is trading inside a short-term descending parallel channel.
BAND
BAND has been moving downwards since April 15, when it reached an all-time high price of $23.35. It initially bounced at the $15.50 area, purportedly validating it as support. However, it has fallen below it since.
In addition, it is in the process of breaking down from an ascending parallel channel. This is a bearish development, that if confirmed could take the price down to the $11 support area.
Technical indicators are bearish. This is especially evident by the bearish cross in the Stochastic Oscillator and RSI cross below 50 (red arrows). It supports the possibility of a drop to the aforementioned $11 support area.
Highlights
- BAND is facing resistance at $15.50
- It is in the process of breaking down from an ascending parallel channel.
For BeInCrypto’s latest bitcoin (BTC) analysis, click here.
Disclaimer
All the information contained on our website is published in good faith and for general information purposes only. Any action the reader takes upon the information found on our website is strictly at their own risk.
Source: https://beincrypto.com/oracle-coins-find-support-as-bitcoin-stabilizes-link-dia-band/
- 2019
- Action
- All
- analysis
- April
- AREA
- barcelona
- bearish
- Bitcoin
- breakout
- BTC
- Bullish
- Coins
- cryptocurrencies
- cryptocurrency
- data
- Development
- Drop
- Economic
- Economics
- facing
- financial
- Focus
- General
- good
- graduate
- Green
- here
- High
- HTTPS
- information
- IT
- latest
- Line
- LINK
- March
- Markets
- oracle
- price
- Reader
- Risk
- School
- support
- Supports
- Technical
- trader
- Trading
- Website
- youtube