“Last year, community count was higher, desirable vacant developed lots were available, and sales caps were unheard of. Trying to compare today’s home sales to last year is like comparing apples to oranges.” – Ali Wolf
NEWPORT BEACH, Calif. (PRWEB) August 20, 2021
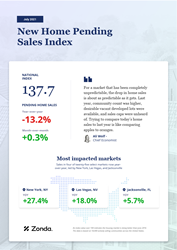
Today, the experts at Zonda, the housing industry’s foremost advisors, released the New Home Pending Sales Index (PSI) for July 2021. The New Home PSI shows pending sales flattened month-over-month but declined year-over-year. The index is a leading residential real estate indicator based on the number of new home sales contracts signed across the country.
-The New Home PSI came in at 137.7 for July, representing a 13.2% decrease from July 2020. The index is 21.8% higher than July 2019.
-On a month-over-month basis, seasonally adjusted new home sales were essentially unchanged from June to July.
-Despite being historically high, the index is now 21% below the peak levels seen in January 2021. The decline is reflective of the housing market’s immense strength over the last year. Conversely, the market remains 11% above the pre-pandemic high seen in February 2020.
The New Home PSI is a unique measure of the housing market because it is made up of two components*: new home orders and the average sales rate per community. The new home orders component fell 30% year-over-year in July as supply continued to diminish. The average sales rate per community input also dropped and went negative, falling 12% year-over-year due primarily to extremely strong comps in 2020.
New home orders look at total sales and will fall based purely on limited supply. The average sales rate per community captures how well builders are selling at the open communities and strips out the supply side. Both components will be negatively impacted by builders intentionally capping sales. Zonda data shows 85% of builders throttled sales in July to better align contract sales with production capacity.
“For a market that has been completely unpredictable, the drop in home sales is about as predictable as it gets,” said Ali Wolf, Zonda’s chief economist. “Last year, community count was higher, desirable vacant developed lots were available, and sales caps were unheard of. Trying to compare today’s home sales to last year is like comparing apples to oranges.”
Pending new home sales trended above July 2020 levels in just four of our 25 select markets, down from 14 last month. Housing’s red-hot stretch started in June 2020 and continued that upward trajectory in July 2020, especially in metros like Salt Lake City, Raleigh and Phoenix. These markets are now experiencing the largest year-over-year declines. Three of the four markets that are currently up compared to the same month last year are lifestyle markets like New York, Las Vegas and Los Angeles. These markets experienced a slower rebound during the summer of 2020 before taking off later in the year as well.
The relationship between the percent change in the average sale rate and new home orders can reflect an imbalance of supply and demand. 24 of the 25 select markets posted a positive spread, indicating volume would rise by simply increasing supply assuming today’s buyer interest is unchanged. Sales remain up year-over-year in terms of the average sales rate in just six of Zonda’s select markets, whereas just one, New York, posted an increase in new home orders compared to last year. Zonda believes that home sales data will continue to be negative on a year-over-year basis throughout the balance of 2021 given the tough comps.
“The housing market is slower than it was a few months ago but the market is far from slow,” said Wolf. “Supply constraints are a big reason home sales have slowed but buyers have played a role as well. Distractions that come with this time of year combined with some buyers fed up with the hot housing market have brought demand levels back down to earth.”
New home data is susceptible to outsized swings in contract activity based on shifts in the number of actively selling communities. As a result, Zonda normalizes the data to ensure consistency across the index. The New Home PSI blends the cumulative sales of active or recently sold-out projects with the average sales rate per community, which adjusts for fluctuations in supply. Furthermore, the New Home PSI is seasonally adjusted based on each markets’ specific seasonality and removes outliers. The index is baselined to 100 for June 2016. Today’s national New Home PSI is 37.7% above the base level.
The next Zonda New Home PSI press release, featuring August 2021 data, will be issued on Wednesday, September 23, 2021 at 9:00 a.m. ET.
*Note that the PSI calculation includes weights and seasonal adjustments. The year-over-year changes related to the components removes both and are just looking at the raw index values.
Methodology
The Zonda New Home Pending Sales Index (PSI) is built on proprietary, industry-leading data that covers 60% of the production new home market across the United States. Reported number of new home pending contracts are gathered and analyzed each month. Released on the 15th business day of each month, the New Home PSI is a leading indicator of housing demand compared to closings because it is based on the number of signed contracts at a new home community. Zonda monitors 18,000 active communities in the country and the homes tracked can be in any stage of construction.
The new home market represents roughly 10% of all transactions, allowing little movements in supply to cause outsized swings in market activity. As a result, the New Home PSI blends the cumulative sales of activity recently sold out projects with the average sales rate per community, which adjusts for fluctuations in supply. Furthermore, the New Home PSI is seasonally adjusted based on each markets’ specific seasonality, removes outliers, and uses June 2016 as the base month. The foundation of the index is a monthly survey conducted by Zonda. It is necessary to monitor both new and existing home sales to establish an accurate picture of the relative health of the residential real estate market.
About Zonda
Zonda provides data-driven housing market solutions to the homebuilding and multifamily industries. From builders to building product manufacturers, mortgage clients, and multifamily executives, we work hand-in-hand with our customers to streamline access to housing data to empower smarter decisions. As a leading brand in residential construction, our mission is to advance the home building industry, because we believe better homes mean better lives and stronger communities. Together, we are building the future of housing.
Share article on social media or email:
- "
- 000
- 100
- 2016
- 2019
- 2020
- 7
- 9
- access
- active
- advisors
- All
- All Transactions
- Allowing
- article
- AUGUST
- Building
- business
- Capacity
- Cause
- change
- chief
- City
- Communities
- community
- component
- construction
- continue
- contract
- contracts
- Customers
- data
- day
- Demand
- Drop
- dropped
- empower
- estate
- executives
- experts
- Fed
- Figure
- future
- Health
- High
- Home
- housing
- How
- HTTPS
- image
- Increase
- index
- industries
- industry
- interest
- IT
- July
- Las Vegas
- leading
- Level
- lifestyle
- Limited
- Los Angeles
- Market
- Markets
- measure
- Media
- Mission
- months
- New York
- news
- open
- orders
- phoenix
- picture
- press
- Press Release
- Product
- Production
- projects
- Raw
- real estate
- Reports
- sale
- sales
- Salt Lake City
- SIX
- Social
- social media
- sold
- Solutions
- spread
- Stage
- started
- States
- summer
- supply
- Survey
- time
- Transactions
- United
- United States
- volume
- Work
- year