Published 19 hours ago
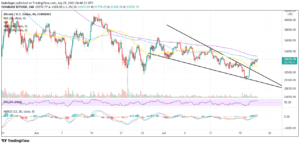
NEAR Price Prediction: The long-coming downtrend in Near protocol price has started turning sideways indicating the exhausted bearish momentum. The resulting consolidation revealed the formation of a famous chart pattern called a symmetrical triangle. Here’s how this pattern can act as a medium for trend reversal and offer entry opportunities to interested traders.
advertisement
Key Points:
- The Near protocol coin may witness a sideways trend until the triangle pattern is intact.
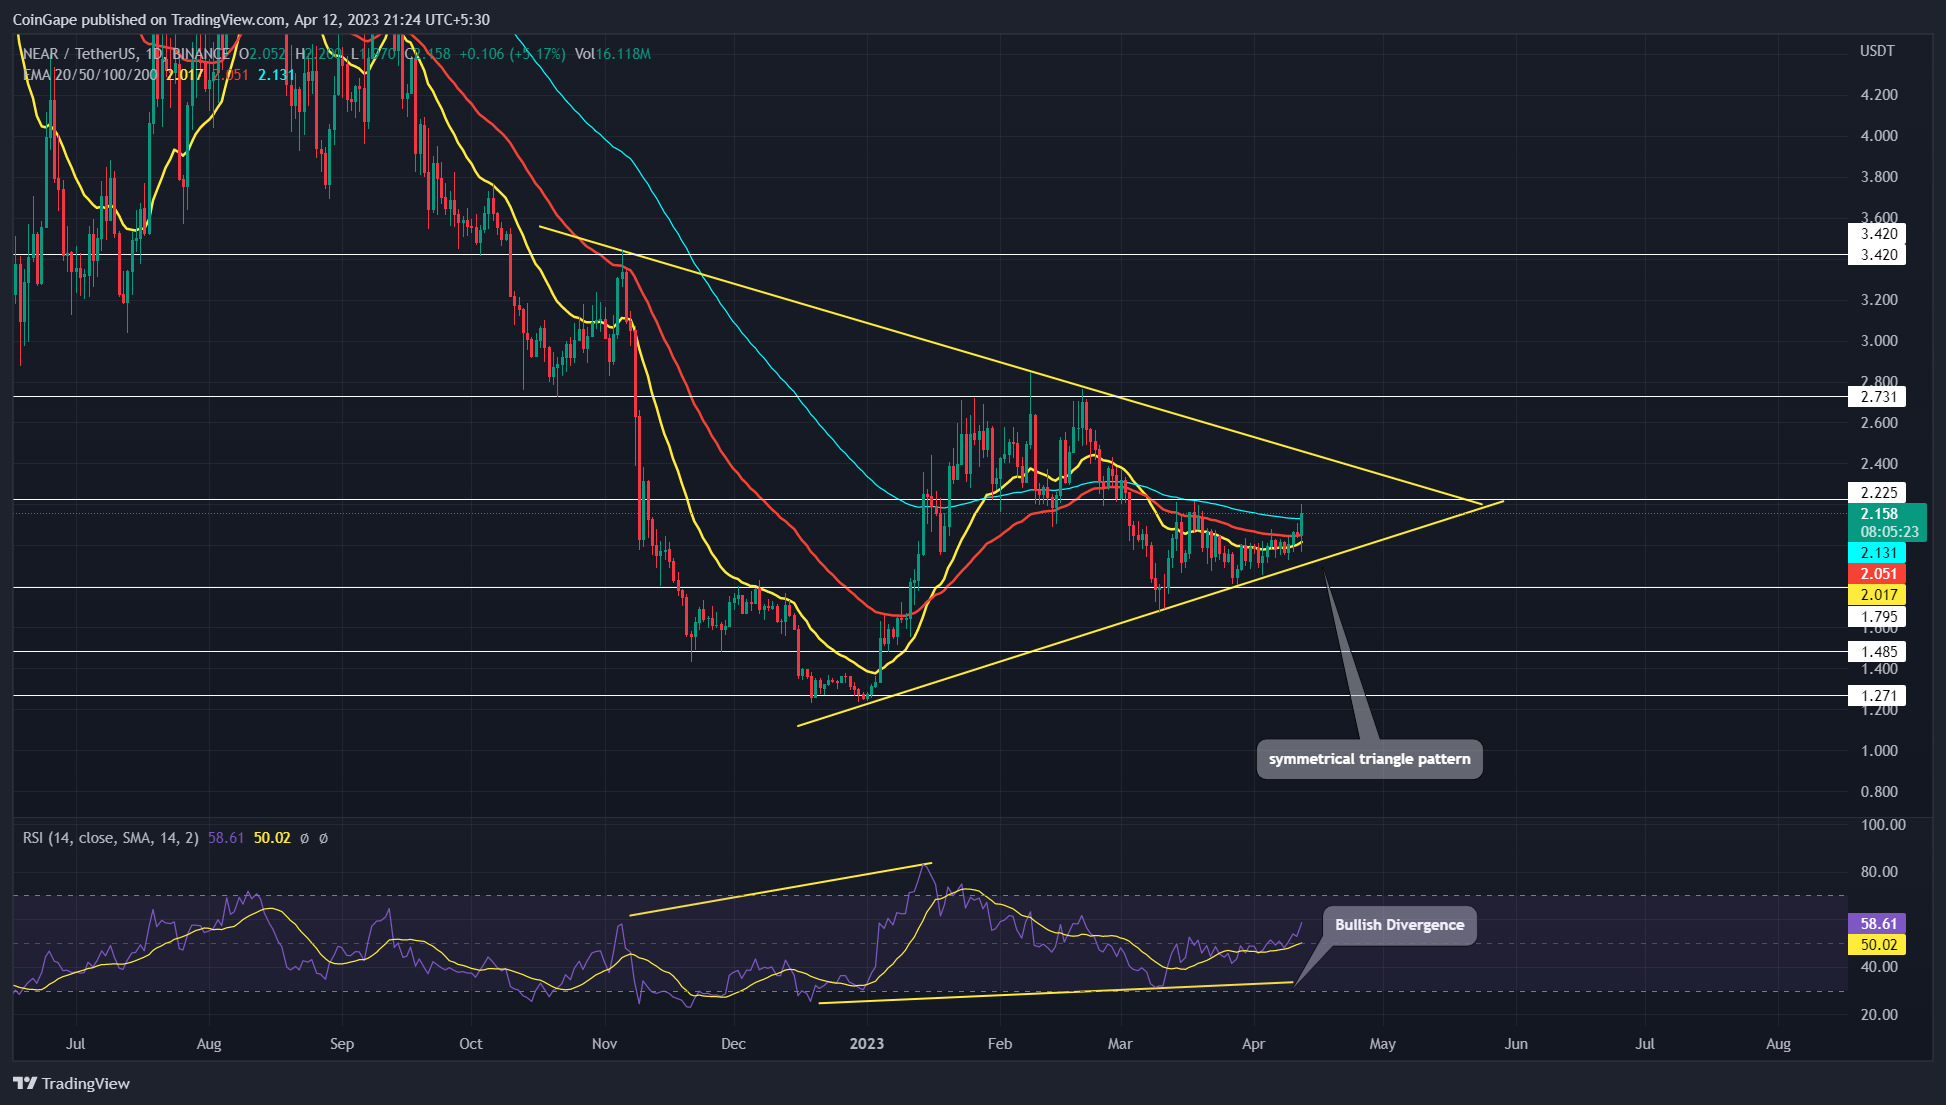
- A potential bullish breakout from the pattern’s resistance trendline may surge the NEAR price to $2.7, followed by the $3.4 mark.
- The intraday trading volume in the NEAR price is $172.5 Million, indicating a 67% gain.
Source- Tradingview
Over the last five months, the Near protocol price resonating between the two converging trend lines reflects a symmetrical triangle pattern formation. The coin price bounced off at least thrice from both the trendline indicating the traders are respecting the pattern setup and could do the same for its potential target.
As of now, the NEAR price trades at the $2.15 mark with an intraday gain of 4.9%. A recent reversal from the pattern’s support trendline has set the prices for a bull cycle within the triangle structure. This bullish reversal may surge the coin’s market value by 13% in the near future to reach the overhead trendline.
Trending Stories
Anyhow, a breakout from either of the aforementioned trendlines is needed to get a clear indication of the future trend.
A potential bullish breakout from the overhead trendline will increase the market buying pressure and surge the prices 40% higher to reach the five-month high of $3.4.
On a contrary note, a daily candle closing below the support trend will hint at the resumption of the prior downtrend.
Technical Indicator
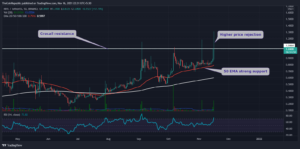
Relative Strength Indicator: An evident growth in the daily RSI slope reflects underlying bullish momentum in rising and the traders have a better chance to breach the overhead trendline.
EMAs: the rising NEAR coin price reclaimed the 20-50-and-100-day EMA slope hints at early signs of a trend reversal.
Near Protocol Coin Intraday Price Levels
- Spot price: $2.16
- Trend: Bullish
- Volatility: Medium
- Resistance level- $2.22 and $2.73
- Support level- $1.8 and $1.4
Share this article on:
advertisement
The presented content may include the personal opinion of the author and is subject to market condition. Do your market research before investing in cryptocurrencies. The author or the publication does not hold any responsibility for your personal financial loss.
<!– Close Story–>
- SEO Powered Content & PR Distribution. Get Amplified Today.
- Platoblockchain. Web3 Metaverse Intelligence. Knowledge Amplified. Access Here.
- Source: https://coingape.com/markets/near-price-prediction-bullish-pattern-setup-bolsters-near-protocol-coin-price-for-40-rally/
- :is
- $3
- 1
- 10
- 7
- 8
- 9
- a
- Act
- Ad
- and
- ARE
- article
- AS
- At
- author
- avatar
- banner
- bearish
- Bearish Momentum
- Beauty
- before
- below
- Better
- between
- Bitcoin
- blockchain
- breach
- breakout
- Brian
- bull
- Bullish
- Buying
- by
- called
- CAN
- Chance
- Chart
- clear
- closing
- Coin
- Coingape
- COM
- condition
- consolidation
- content
- contrary
- converging
- could
- cryptocurrencies
- cryptocurrency
- cycle
- daily
- different
- Early
- either
- Entertainment
- entry
- Ether (ETH)
- famous
- Fashion
- finance
- financial
- follow
- followed
- For
- formation
- from
- future
- Gain
- get
- Growth
- Have
- High
- higher
- hints
- hold
- HOURS
- How
- HTTPS
- i
- in
- include
- Including
- Increase
- indicating
- indication
- Indicator
- interested
- investing
- ITS
- journalism
- jpg
- Last
- lines
- loss
- mark
- Market
- market research
- market value
- May..
- medium
- million
- Momentum
- months
- Near
- NEAR price
- NEAR Price Prediction
- NEAR Protocol
- Near Protocol (NEAR)
- needed
- of
- offer
- on
- Opinion
- opportunities
- past
- Pattern
- personal
- plato
- Plato Data Intelligence
- PlatoData
- plugin
- points
- potential
- prediction
- presented
- pressure
- price
- Price Prediction
- Prices
- Prior
- protocol
- Publication
- rally
- reach
- Read
- recent
- reflects
- research
- Resistance
- respecting
- responsibility
- resulting
- Revealed
- Reversal
- rising
- same
- set
- setup
- Share
- sideways
- Signs
- Slope
- started
- strength
- structure
- subject
- support
- surge
- Symmetrical Triangle
- Target
- The
- The Future
- to
- Topics
- Traders
- trades
- Trading
- trading volume
- TradingView
- Trend
- trending
- Turning
- underlying
- value
- variety
- volume
- will
- with
- within
- witness
- Work
- working
- written
- years
- Your
- zephyrnet