- The US Dollar stalls giving Natural Gas a boost after Federal Reserve Chairman Powell’s testimony to Congress.
- Natural Gas finds support after Tuesday’s decline as higher-than-expected demand for Gas used in cooling puts a floor under prices.
- Concerns regarding Norwegian supply after data showed a slump in May and news of earlier-than-expected outages further supports.
- Possible bear flag on the four-hour chart bodes ill for prices and could tempt bears back into the fray.
Natural Gas price consolidates on Wednesday after the sharp decline witnessed in previous sessions. Hotter-than-expected weather is one factor preventing deeper declines, with forecasts of temperatures in Texas reaching 100 degrees Fahrenheit this week, expected to put pressure on Gas supplies used in air conditioning, according to a report by Natural Gas World.
Gas is also supported by bearish US Dollar action. The world’s reserve currency seems to have lost ground after US Federal Reserve (Fed) Chairman Jerome Powell’s testimony to Congress. Natural Gas is mainly priced and traded in US Dollars so a pullback in the currency tends to result in a lift for Gas prices.
XNG/USD is trading at $2.621 MMBtu, at the time of writing, during the US session on Wednesday.
Natural Gas news and market movers
- Natural Gas prices are supported by a pullback in the US Dollar after Fed Chair Powell’s testimony to Congress. Although Powell reiterated the statement that the Fed probably needs to hike rates further to stem rampant inflation, the Dollar fails to extend its rally, and actually declines following the event.
- If this week’s unexpectedly warm weather is a precursor of more to come, then demand for Natural Gas for air conditioning could start to outstrip demand, according to Natural Gas World (NGW).
- NGW forecasts Cooling Degree Days (CDD), a standard metric used in the industry, to average 332 Fahrenheit days this summer (June – August), on a par with the three-year average.
- Yet if temperatures surprise to the upside as it looks possible, it will soon put pressure on the grid and raise prices, says NGW.
- “Weather is unpredictable and our forecasts are conservative as a result, so if temperatures are warmer than the three-year average, gas for power demand averages will be higher than expected.” NGW reports.
- Natural Gas prices as per the Netherlands-based Transfer Title Facility (TTF) recovered over 10% overnight on continued Norwegian supply concerns.
- The TTF rose to $11.92 per million British thermal units (MMBtu) on 20 June after sinking to $10 MMBtu the day before from a high of over $14, according to NGW.
- Gas prices rose on Tuesday after production data from the Norwegian Petroleum Directorate (NPD) in May, came out 7.3% below forecasts.
- Norway produced 274 Mega Standard Cubic Meters (MSm³) of Gas in May, 21.9 MSm³ less than forecast and less than the 339.8 produced in April and the 324.1 MSm³ in May 2022.
- This further exacerbates Norwegian supply concerns after the news of longer-than-expected outages at Norwegian Gas plants.
- The European market has also been impacted by rumors of an earlier-than-expected closure of the Groningen Gas field in the Netherlands.
- Norwegian supply is now critical to the European continent after it replaced Russia as the main supplier in 2022, when Norwegian Gas accounted for 23% of imports compared to Russia’s 15%, according to a report by CNN.
- “The European gas market — and by extension the global gas market — [is] certainly not out of the woods in terms of adequately matching supply with demand,” Tom Marzec-Manser, head of Gas analytics at ICIS, told CNN.
- That said the position is not as precarious as in previous years: European storage facilities are now 73% full — a much higher level than the 56% averaged at the same time of the year over the past five years, according to data from Gas Infrastructure Europe (reported by CNN).
- In addition, news of a deal between Romanian Gas operator RomGaz and Southeast European Gas producer Petrom OMV to build a new platform in the Black Sea is likely to ease regional demand concerns, according to Offshore Energy.
- The Neptun Deep offshore Gas field will make Romania the largest Gas producer in the EU, and a net exporter.
- “To give an example of the project’s size: the estimated natural gas production is equivalent to ~30 times the current annual demand of ~4,300,000 households. It is also a major step forward for our Strategy 2030 that aims at supporting the energy transition in Romania and in the region.” Said Christina Verchere, CEO of OMV Petrom.
- Asian rivalry for Europe’s limited supply is likely to be less than in previous years after Japan and South Korea recorded much higher stores and the Chinese economy continues to falter.
- The ongoing Atlantic hurricane season in the US could further increase demand in the US.
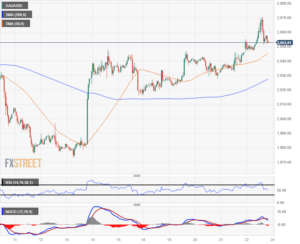
Natural Gas Technical Analysis: Short-term uptrend within a longer-term bearish picture
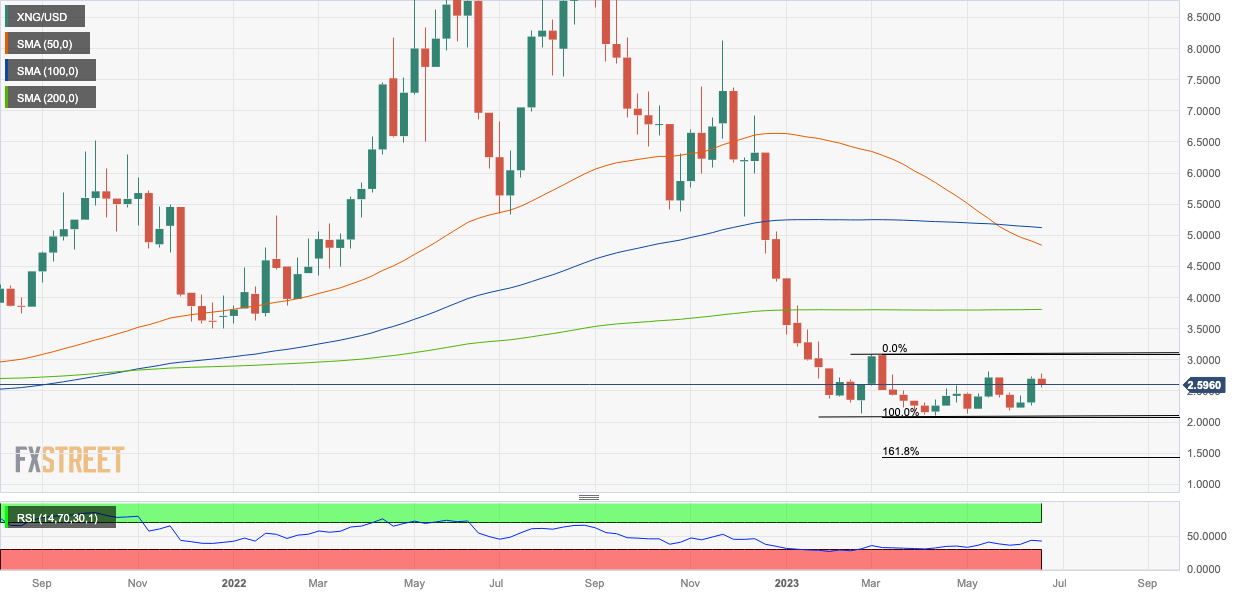
Natural Gas price is in a long-term downtrend since turning lower at the $9.960 MMBtu peak achieved in August 2022. That said, bearish momentum has tapered off considerably since February 2023. This is evidenced by the bullish convergence of the Relative Strength Index (RSI) momentum indicator with price, beginning in May this year. Bullish convergence occurs when price makes new lows but RSI fails to copy.
In actual fact, the RSI started rising well before price did, which was indicative of an underlying change in environment. Until price goes a bit higher, however, the trend remains down.
Natural Gas would need to break above the last lower high of the long-term downtrend at $3.079 MMBtu to indicate a reversal in the broader trend.
As things stand, a break below the $2.110 MMBtu year-to-date lows would provide a signal for a continuation down to a target at $1.546 MMBtu. This target is the 61.8% Fibonacci extension of the height of the roughly sideways consolidation range that has been unfolding during 2023.
-638229506464457979.png)
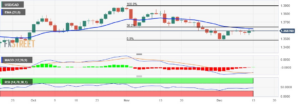
Natural Gas: Weekly Chart
On the daily chart, it can be seen that price is going sideways, although it has now broken above both the 50 and not the 100-day Simple Moving Average (SMA), which is a short-term bullish sign.
-638229506895489086.png)
Natural Gas: Daily Chart
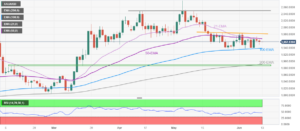
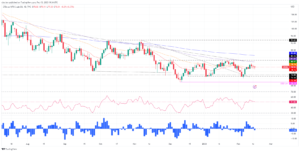
The four-hour chart shows the pair has reversed its prior short-term uptrend.
-638229507387732882.png)
Natural Gas: Four-hour Chart
The steep decline witnessed on Tuesday broke below the last lower high at roughly $2.650 and could spell a change in direction for Natural Gas in the short term.
The RSI has exited overbought (above 70), which is a signal for bulls to close their long positions and bears to open short positions.
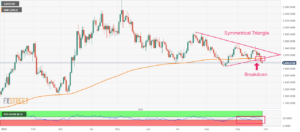
Price action on the four-hour chart may have formed a bear flag, with the recent cliff-edge decline from Tuesday’s highs as the ‘flag pole’ and the consolidation on Wednesday as the ‘flag square’.
-638229507855206004.png)
Natural Gas: Four-hour Chart
If so, price will probably break lower and extend a similar, or Fibonacci 61.8%, of the length of the pole, to a target at roughly $2.430, around where the 200-4hr SMA is situated.
A decisive break below $2.558 would be required to activate the flag pattern and confirm more downside. Such a break would need to be composed of a long red bearish four-hour candlestick, which breaks below the level and closes near its lows, or three red candlesticks in a row that break below the level.
The target for the flag also lies at about the same level as the 100 and 50-day SMAs, further enhancing it as a possible floor for prices to pause and find support.
Fed FAQs
What does the Federal Reserve do, how does it impact the US Dollar?
Monetary policy in the US is shaped by the Federal Reserve (Fed). The Fed has two mandates: to achieve price stability and foster full employment. Its primary tool to achieve these goals is by adjusting interest rates.
When prices are rising too quickly and inflation is above the Fed’s 2% target, it raises interest rates, increasing borrowing costs throughout the economy. This results in a stronger US Dollar (USD) as it makes the US a more attractive place for international investors to park their money.
When inflation falls below 2% or the Unemployment Rate is too high, the Fed may lower interest rates to encourage borrowing, which weighs on the Greenback.
How often does the Fed hold monetary policy meetings?
The Federal Reserve (Fed) holds eight policy meetings a year, where the Federal Open Market Committee (FOMC) assesses economic conditions and makes monetary policy decisions.
The FOMC is attended by twelve Fed officials – the seven members of the Board of Governors, the president of the Federal Reserve Bank of New York, and four of the remaining eleven regional Reserve Bank presidents, who serve one-year terms on a rotating basis.
What is Quantitative Easing (QE) and how does it impact USD?
In extreme situations, the Federal Reserve may resort to a policy named Quantitative Easing (QE). QE is the process by which the Fed substantially increases the flow of credit in a stuck financial system.
It is a non-standard policy measure used during crises or when inflation is extremely low. It was the Fed’s weapon of choice during the Great Financial Crisis in 2008. It involves the Fed printing more Dollars and using them to buy high grade bonds from financial institutions. QE usually weakens the US Dollar.
What is Quantitative Tightening (QT) and how does it impact the US Dollar?
Quantitative tightening (QT) is the reverse process of QE, whereby the Federal Reserve stops buying bonds from financial institutions and does not reinvest the principal from the bonds it holds maturing, to purchase new bonds. It is usually positive for the value of the US Dollar.
- SEO Powered Content & PR Distribution. Get Amplified Today.
- EVM Finance. Unified Interface for Decentralized Finance. Access Here.
- Quantum Media Group. IR/PR Amplified. Access Here.
- PlatoAiStream. Web3 Data Intelligence. Knowledge Amplified. Access Here.
- Source: https://www.fxstreet.com/news/natural-gas-price-finds-a-floor-on-air-conditioning-demand-as-summer-heats-up-202306211328
- :has
- :is
- :not
- :where
- $3
- 000
- 1
- 100
- 110
- 15%
- 19
- 2%
- 20
- 2008
- 2022
- 2023
- 2030
- 300
- 50
- 7
- 70
- 8
- 9
- a
- About
- above
- According
- Achieve
- achieved
- Action
- actual
- actually
- addition
- adequately
- After
- aims
- AIR
- Air Conditioning
- also
- Although
- an
- analysis
- analytics
- and
- annual
- April
- ARE
- around
- AS
- At
- attractive
- AUGUST
- average
- back
- Bank
- basis
- BE
- Bear
- bearish
- Bearish Momentum
- Bears
- been
- before
- Beginning
- below
- between
- Bit
- Black
- board
- Bonds
- boost
- Borrowing
- both
- Break
- breaks
- British
- broader
- Broke
- Broken
- build
- Bullish
- Bulls
- but
- buy
- Buying
- by
- came
- CAN
- ceo
- certainly
- Chair
- chairman
- change
- Chart
- chinese
- choice
- Close
- Closes
- closure
- CNN
- come
- committee
- compared
- composed
- Concerns
- conditions
- Confirm
- Congress
- conservative
- Consolidates
- consolidation
- continent
- continuation
- continued
- continues
- Convergence
- Costs
- could
- credit
- crisis
- critical
- Currency
- Current
- daily
- data
- day
- Days
- deal
- decisions
- decisive
- Decline
- Declines
- deep
- deeper
- Degree
- Demand
- DID
- direction
- do
- does
- Dollar
- dollars
- down
- downside
- during
- ease
- easing
- Economic
- Economic Conditions
- economy
- eleven
- employment
- encourage
- energy
- enhancing
- Environment
- Equivalent
- estimated
- EU
- Europe
- European
- European gas
- Europes
- Event
- evidenced
- example
- expanded
- expected
- extend
- extension
- extreme
- extremely
- facilities
- Facility
- fact
- factor
- fails
- Falls
- FAQ
- February
- Fed
- Fed Chair
- Fed Chair Powell
- Federal
- Federal Open Market Committee
- federal reserve
- Federal Reserve Bank
- Federal Reserve Bank of New York
- Federal Reserve Chairman
- Fibonacci
- field
- financial
- financial crisis
- Financial institutions
- financial system
- Find
- finds
- five
- Floor
- flow
- following
- FOMC
- For
- Forecast
- forecasts
- formed
- Forward
- Foster
- four
- from
- full
- further
- GAS
- Gas Price
- gas prices
- Give
- Giving
- Global
- Goals
- Goes
- going
- grade
- great
- Greenback
- Grid
- Ground
- Have
- head
- height
- High
- higher
- Highs
- Hike
- hold
- holds
- households
- How
- However
- HTTPS
- hurricane
- if
- Impact
- impacted
- imports
- in
- Increase
- Increases
- increasing
- index
- indicate
- indicative
- Indicator
- industry
- inflation
- Infrastructure
- institutions
- interest
- Interest Rates
- International
- international investors
- into
- Investors
- IT
- ITS
- Japan
- jerome
- jerome powell
- june
- korea
- largest
- Last
- Length
- less
- Level
- lies
- likely
- Limited
- Long
- long-term
- LOOKS
- lost
- Low
- lower
- Lows
- Main
- mainly
- major
- make
- MAKES
- mandates
- Market
- matching
- May..
- measure
- meetings
- Mega
- Members
- metric
- million
- Momentum
- Monetary
- Monetary Policy
- money
- more
- moving
- moving average
- much
- Named
- Natural
- Natural Gas
- Near
- Need
- needs
- net
- Netherlands
- New
- New Platform
- New York
- news
- Norwegian
- now
- of
- off
- officials
- often
- on
- ONE
- ongoing
- open
- operator
- or
- our
- out
- Outages
- over
- overnight
- pair
- Park
- past
- Pattern
- pause
- Peak
- Petroleum
- Place
- plants
- platform
- plato
- Plato Data Intelligence
- PlatoData
- policy
- position
- positions
- positive
- possible
- Powell
- power
- precursor
- president
- Presidents
- pressure
- preventing
- previous
- price
- Prices
- primary
- Principal
- printing
- Prior
- probably
- process
- Produced
- producer
- Production
- projects
- provide
- pullback
- purchase
- put
- Puts
- QE
- QT
- quantitative
- Quantitative Easing
- quantitative tightening
- quickly
- raise
- raises
- rally
- range
- Rate
- Rates
- reaching
- recent
- recorded
- Recovers
- Red
- regarding
- region
- regional
- reinvest
- relative
- relative strength index
- Relative Strength Index (RSI)
- remaining
- remains
- replaced
- report
- Reported
- Reports
- required
- Reserve
- reserve bank
- Reserve Currency
- Resort
- result
- Results
- Reversal
- reverse
- rising
- rivalry
- Romania
- Romanian
- ROSE
- roughly
- ROW
- rsi
- Rumors
- Russia
- s
- Said
- same
- says
- SEA
- Season
- seems
- seen
- serve
- session
- sessions
- seven
- shaped
- sharp
- Short
- short-term
- showed
- Shows
- sideways
- sign
- Signal
- similar
- Simple
- since
- situations
- Size
- Slump
- SMA
- SMAs
- So
- Soon
- South
- South Korea
- SPELL
- Stability
- stand
- standard
- start
- started
- Statement
- Stem
- Step
- Stops
- storage
- stores
- Strategy
- strength
- stronger
- substantially
- such
- summer
- supply
- support
- Supported
- Supporting
- Supports
- surprise
- system
- Target
- Technical
- Technical Analysis
- term
- terms
- testimony
- texas
- than
- that
- The
- the Fed
- the Netherlands
- the world
- their
- Them
- then
- thermal
- These
- things
- this
- this week
- this year
- three
- throughout
- tightening
- time
- times
- Title
- to
- too
- tool
- traded
- Trading
- transfer
- transition
- Trend
- Tuesday
- Turning
- two
- under
- underlying
- unemployment
- unemployment rate
- unfolding
- units
- unpredictable
- until
- Upside
- uptrend
- us
- US Dollar
- US Dollars
- US Federal
- us federal reserve
- USD
- used
- using
- usually
- value
- warm
- Warmer
- was
- Weather
- Wednesday
- week
- weekly
- weighs
- WELL
- when
- which
- WHO
- will
- with
- within
- witnessed
- Woods
- world
- would
- writing
- year
- years
- york
- zephyrnet