- Bearish elements have emerged at a key inflection/resistance level of 15,415.
- The leader of the AI boom, Nvidia has shaped a bullish exhaustion where its initial price actions’ exuberance dissipated ex-post Q2 earnings result release.
- 15,135 key short-term resistance to watch on the Nasdaq 100 to maintain bearish bias.
This is a follow-up analysis of our prior reports, “Nasdaq 100 Technical: Minor countertrend rebound” and “D-day for the US stock market as Nvidia earnings loom” published on 15 August 2023 and 23 August 2023 respectively. Click here and here for a recap.
The price actions of the US Nas 100 Index (a proxy for the Nasdaq 100 futures) have indeed shaped the expected minor countertrend rebound sequence from the 18 August 2023 low of 14,553 and rallied by +5.6% to print an intraday high of 15,375 during yesterday’s 24 August European opening hour.
The upward spurt seen on Thursday, 24 August at the start of the Asian session has been primarily attributed to a strong upmove of +6% seen in the share price of Nvidia in the after-US hours trading session of Wednesday, 23 August right after the release of its stellar fiscal Q2 earnings result.
Interestingly, the exuberance of Nvidia that has triggered an initial positive feedback loop into the benchmark US stock indices dissipated as the US session got underway yesterday.
In addition, several key bearish technical elements emerged which suggests that the potential impulsive down moves of the short to medium-term bearish trend of the US Nas 100 Index has resumed.
Daily bearish Marubozu candlestick formed right a key inflection/resistance zone
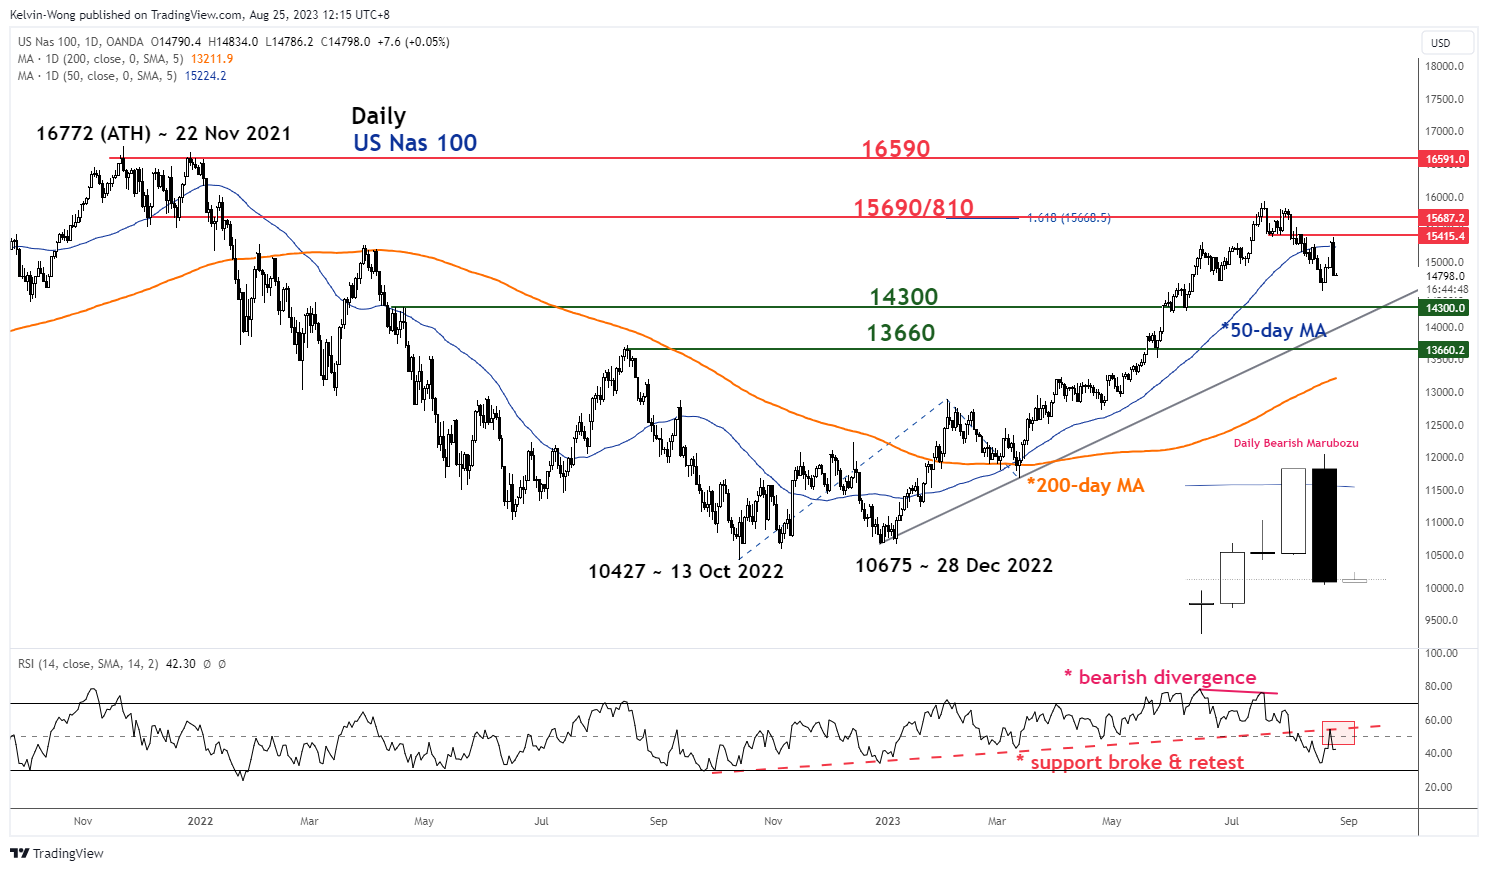
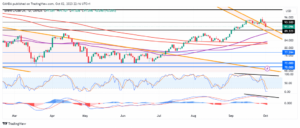
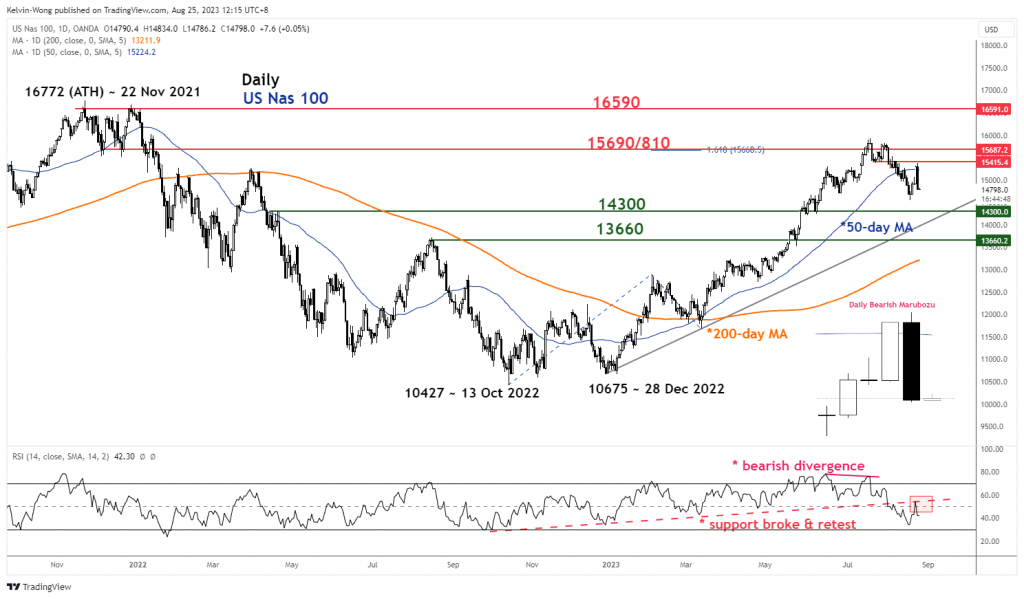
Fig 1: US Nas 100 medium-term trend as of 25 Aug 2023 (Source: TradingView, click to enlarge chart)
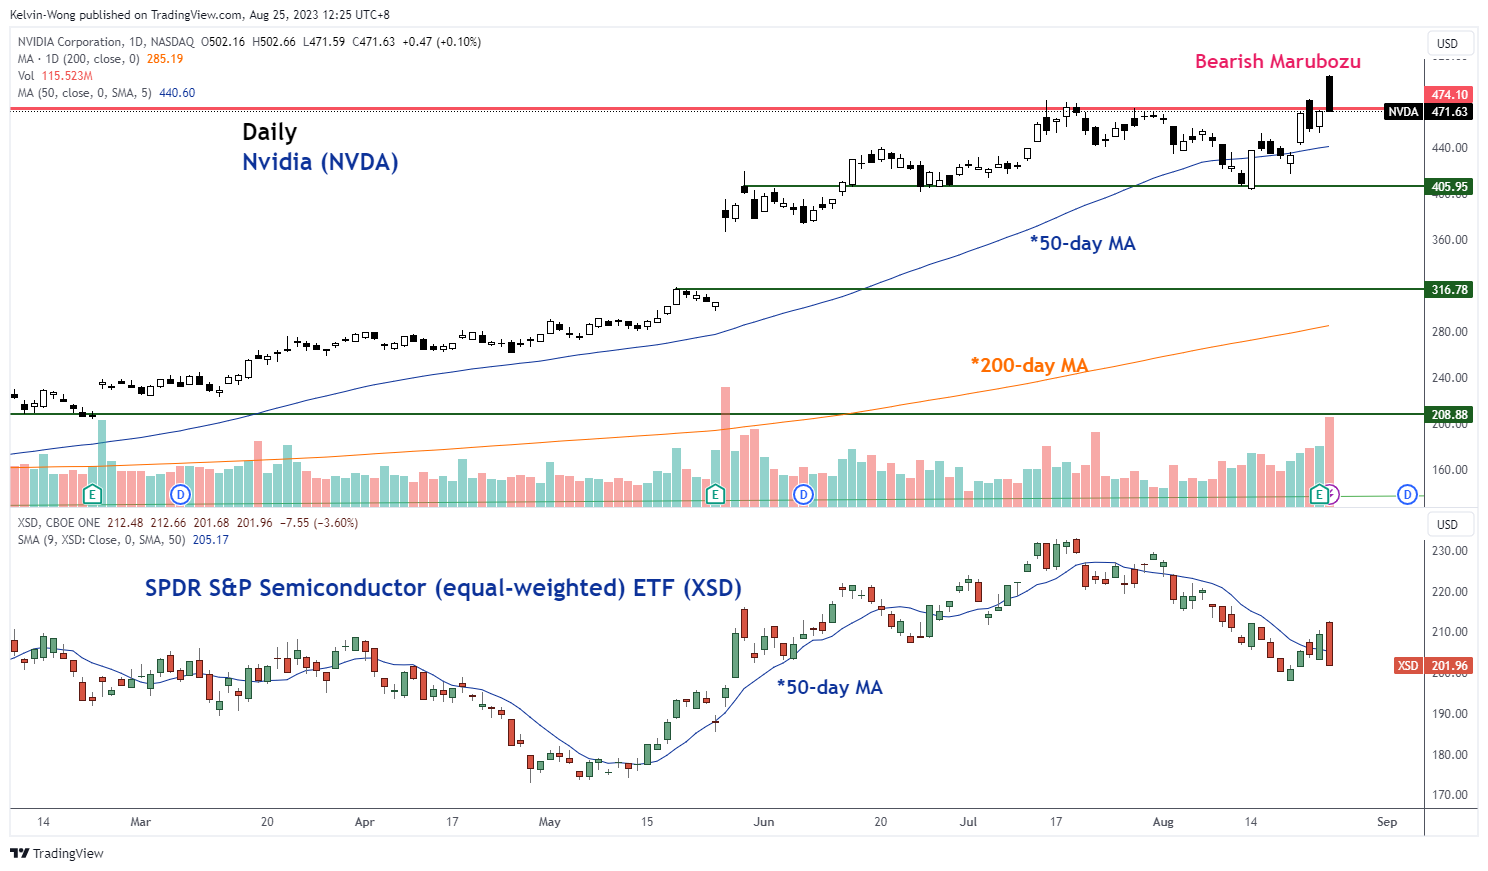
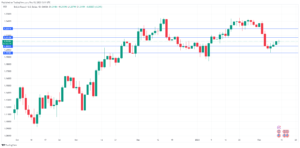
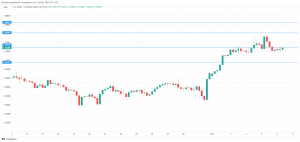
Fig 2: Medium-term trend of Nvidia & SPDR S&P Semiconductor ETF as of 24 Aug 2023 (Source: TradingView, click to enlarge chart)
As seen in Figure 1, several bearish elements have been detected on the daily chart of the US Nas 100 Index. Firstly, its price actions have formed a firm bearish tone candlestick pattern called “Marubozu”, a long-body candle where its opening price and closing price were almost the same as its intraday high and intraday low respectively.
Secondly, the emergence of such a key bearish reversal candlestick pattern is being formed right at a key inflection zone where the 50-day moving average and the former swing low of 24 July 2023 confluence at a 15,415 resistance level adds credence to a potential future bearish movement in price actions of the Index.
Thirdly, the current conditions of the daily RSI oscillator suggest that medium-term downside momentum remains intact.
The price actions of Nvidia as seen in Fig 2 have also depicted similar bearish elements where it ended yesterday’s 24 August US session with a daily bearish “Marubozu” and reintegrated below a key resistance of 474.10 with a high-volume reading.
The US Nas 100 slipped back below the 20-day moving average
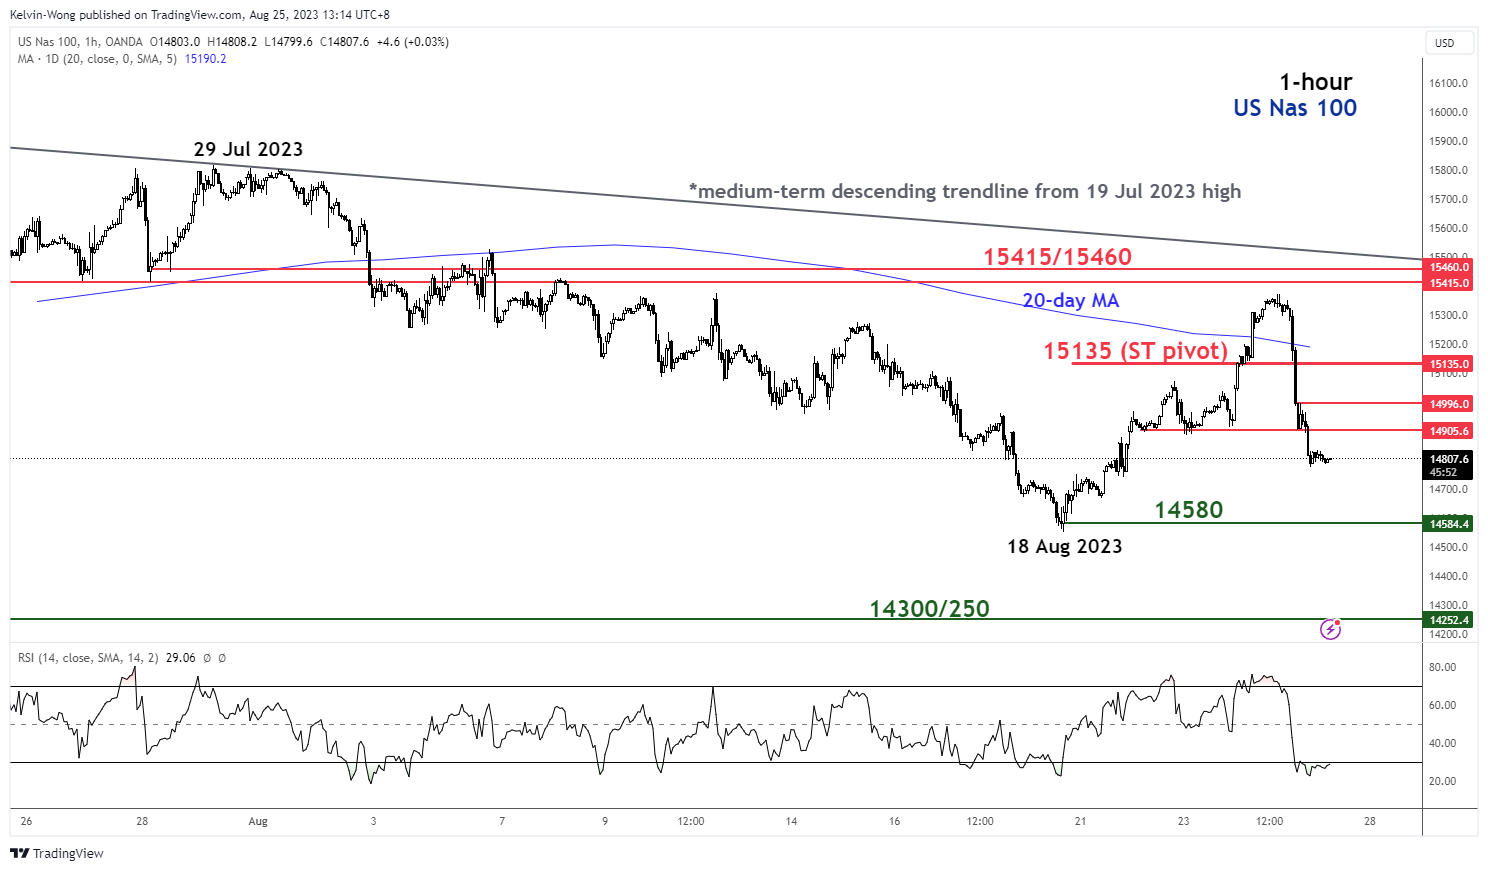
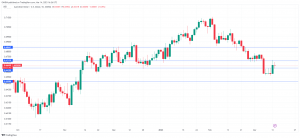
Fig 3: US Nas 100 minor short-term trend as of 25 Aug 2023 (Source: TradingView, click to enlarge chart)
The hourly chart of the US Nas 100 has indicated the potential continuation of the impulsive down move of its short-term downtrend phase as the minor countertrend rebound from the 18 August 2023 low is likely to be over.
Watch the 15,135 key short-term pivotal resistance (also the 20-day moving average) to maintain the bearish tone and a break below 14,580 exposes the next support at 14,300/250 (Fibonacci extension cluster & and a graphical support, refer to the daily chart in Fig 1).
On the other hand, a clearance above 15,135 negates the bearish tone to see a retest on the 15,415/460 medium-term resistance.
Content is for general information purposes only. It is not investment advice or a solution to buy or sell securities. Opinions are the authors; not necessarily that of OANDA Business Information & Services, Inc. or any of its affiliates, subsidiaries, officers or directors. If you would like to reproduce or redistribute any of the content found on MarketPulse, an award winning forex, commodities and global indices analysis and news site service produced by OANDA Business Information & Services, Inc., please access the RSS feed or contact us at info@marketpulse.com. Visit https://www.marketpulse.com/ to find out more about the beat of the global markets. © 2023 OANDA Business Information & Services Inc.
Latest posts by Kelvin Wong (see all)
- SEO Powered Content & PR Distribution. Get Amplified Today.
- PlatoData.Network Vertical Generative Ai. Empower Yourself. Access Here.
- PlatoAiStream. Web3 Intelligence. Knowledge Amplified. Access Here.
- PlatoESG. Automotive / EVs, Carbon, CleanTech, Energy, Environment, Solar, Waste Management. Access Here.
- PlatoHealth. Biotech and Clinical Trials Intelligence. Access Here.
- ChartPrime. Elevate your Trading Game with ChartPrime. Access Here.
- BlockOffsets. Modernizing Environmental Offset Ownership. Access Here.
- Source: https://www.marketpulse.com/indices/nasdaq-100-technical-bearish-momentum-reasserts/kwong
- :has
- :is
- :not
- :where
- ][p
- 1
- 10
- 100
- 14
- 15 years
- 15%
- 2023
- 23
- 24
- 25
- 700
- a
- About
- above
- access
- actions
- addition
- Adds
- advice
- affiliates
- After
- AI
- also
- an
- analysis
- and
- any
- ARE
- around
- AS
- asian
- At
- Aug
- AUGUST
- author
- authors
- avatar
- average
- award
- back
- BE
- bearish
- Bearish Momentum
- been
- being
- below
- Benchmark
- bias
- boom
- Box
- Break
- Bullish
- business
- buttons
- buy
- by
- called
- Chart
- clearance
- click
- closing
- Cluster
- COM
- combination
- Commodities
- conditions
- conducted
- Connecting
- contact
- content
- continuation
- courses
- Current
- daily
- detected
- Directors
- down
- downside
- during
- Earnings
- elements
- Elliott
- emerged
- emergence
- enlarge
- ETF
- Ether (ETH)
- European
- exchange
- expected
- experience
- expert
- extension
- feedback
- Fibonacci
- Fig
- Figure
- financial
- Find
- Firm
- Fiscal
- flow
- For
- foreign
- foreign exchange
- forex
- formed
- Former
- found
- from
- fund
- fundamental
- future
- Futures
- General
- Global
- global markets
- hand
- Have
- High
- hour
- HOURS
- HTTPS
- if
- impulsive
- in
- Inc.
- index
- indicated
- Indices
- Inflection
- information
- initial
- into
- investment
- IT
- ITS
- July
- Kelvin
- Key
- key resistance
- Last
- leader
- Level
- levels
- like
- likely
- Low
- Macro
- maintain
- Market
- market outlook
- market research
- MarketPulse
- Markets
- max-width
- minor
- Momentum
- more
- move
- movement
- moves
- moving
- moving average
- nas
- Nasdaq
- Nasdaq 100
- necessarily
- news
- next
- numerous
- Nvidia
- of
- officers
- on
- only
- opening
- Opinions
- or
- Other
- our
- out
- Outlook
- over
- passionate
- Pattern
- perspectives
- phase
- photo
- pivotal
- plato
- Plato Data Intelligence
- PlatoData
- please
- positioning
- positive
- Posts
- potential
- price
- primarily
- Prior
- Produced
- providing
- proxy
- published
- purposes
- Q2
- Reading
- rebound
- recap
- release
- remains
- Reports
- research
- Resistance
- respectively
- result
- retail
- Reversal
- right
- rsi
- rss
- S&P
- same
- Securities
- see
- seen
- sell
- semiconductor
- senior
- Sequence
- service
- Services
- session
- several
- shaped
- Share
- sharing
- Short
- short-term
- similar
- Singapore
- site
- solution
- Source
- specializing
- start
- Stellar
- stock
- stock market
- Stock markets
- Strategist
- strong
- such
- suggest
- Suggests
- support
- Swing
- Technical
- Technical Analysis
- ten
- that
- The
- thousands
- thursday
- to
- TONE
- Traders
- Trading
- TradingView
- Training
- Trend
- triggered
- Underway
- unique
- upward
- us
- US Stock Market
- using
- v1
- Visit
- Watch
- Wave
- Wednesday
- WELL
- were
- which
- winning
- with
- wong
- would
- years
- yesterday
- you
- zephyrnet