By , PhD Student, Microplastic Pollution, University of East London, writing in The Conversation.
At a first glance the COVID-19 pandemic seemed to have a positive impact on the environment, with significant decreases in greenhouse gas emissions, and transport-related noise, air and light pollution.
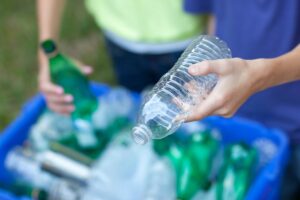
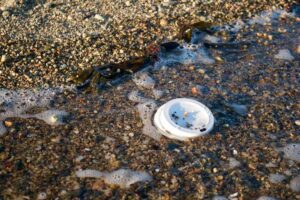
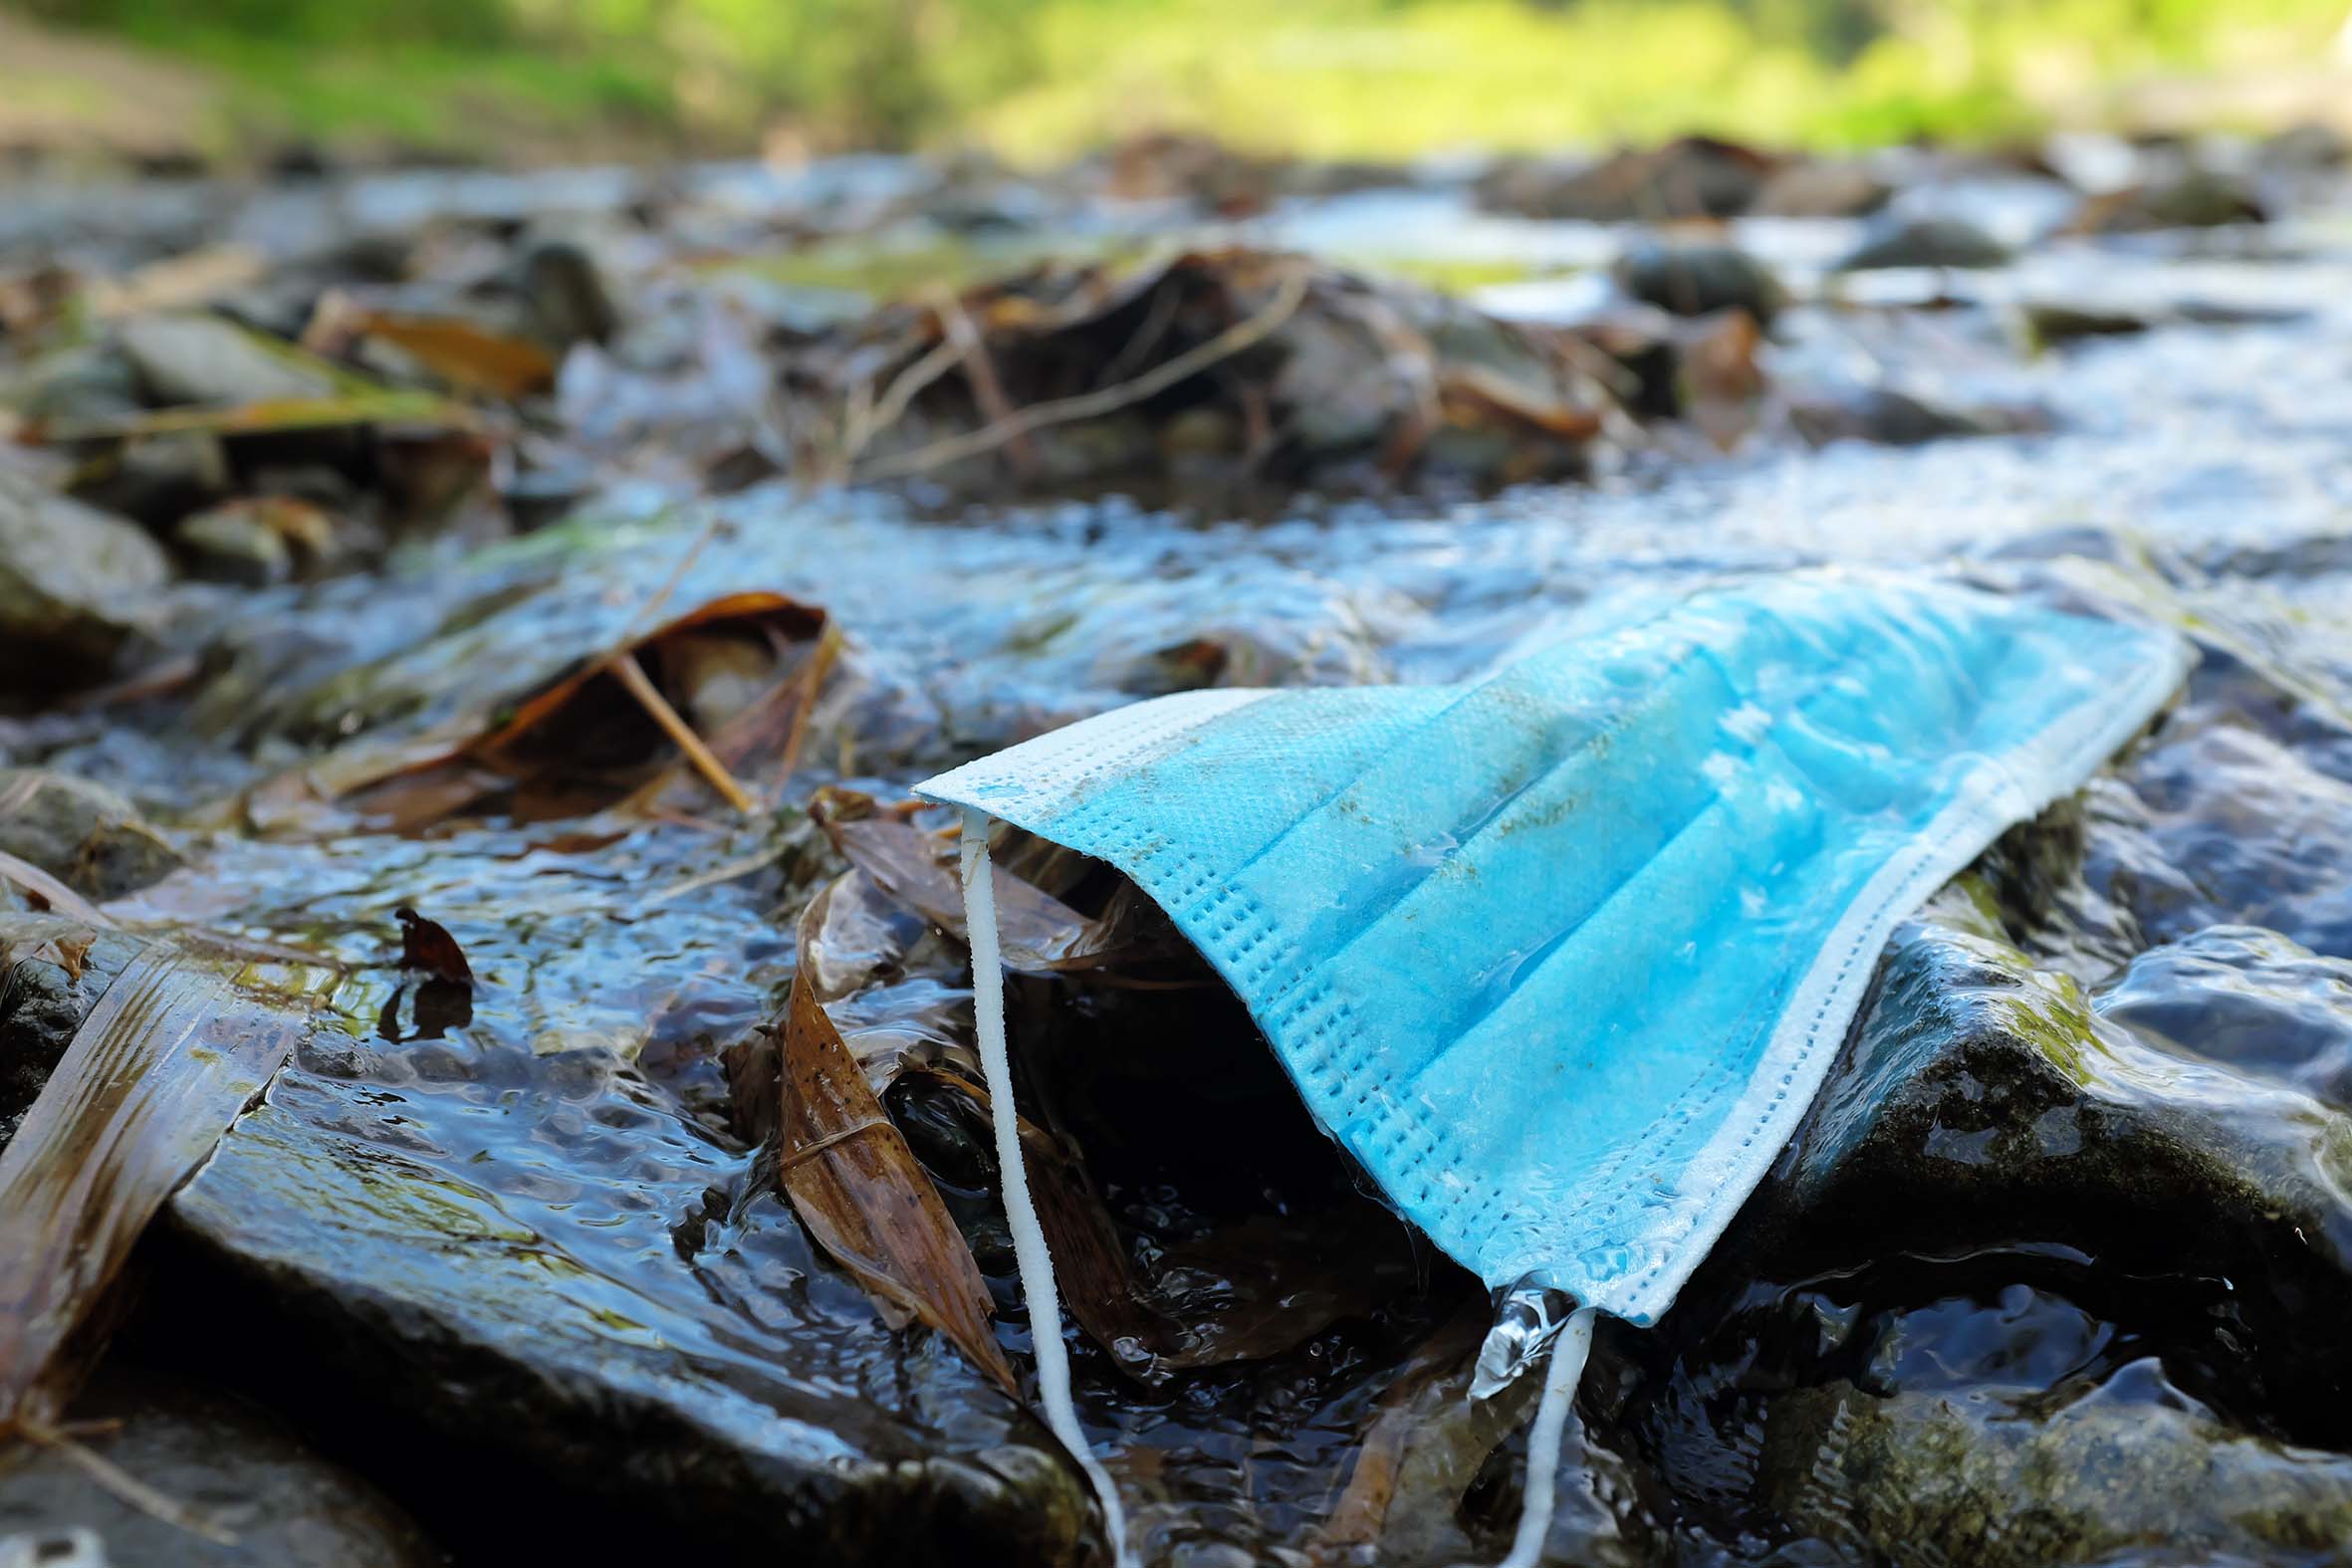
However, our research found discarded face coverings and other personal protective equipment (PPE) are likely to be the cause of a rise in microplastics entering the environment.
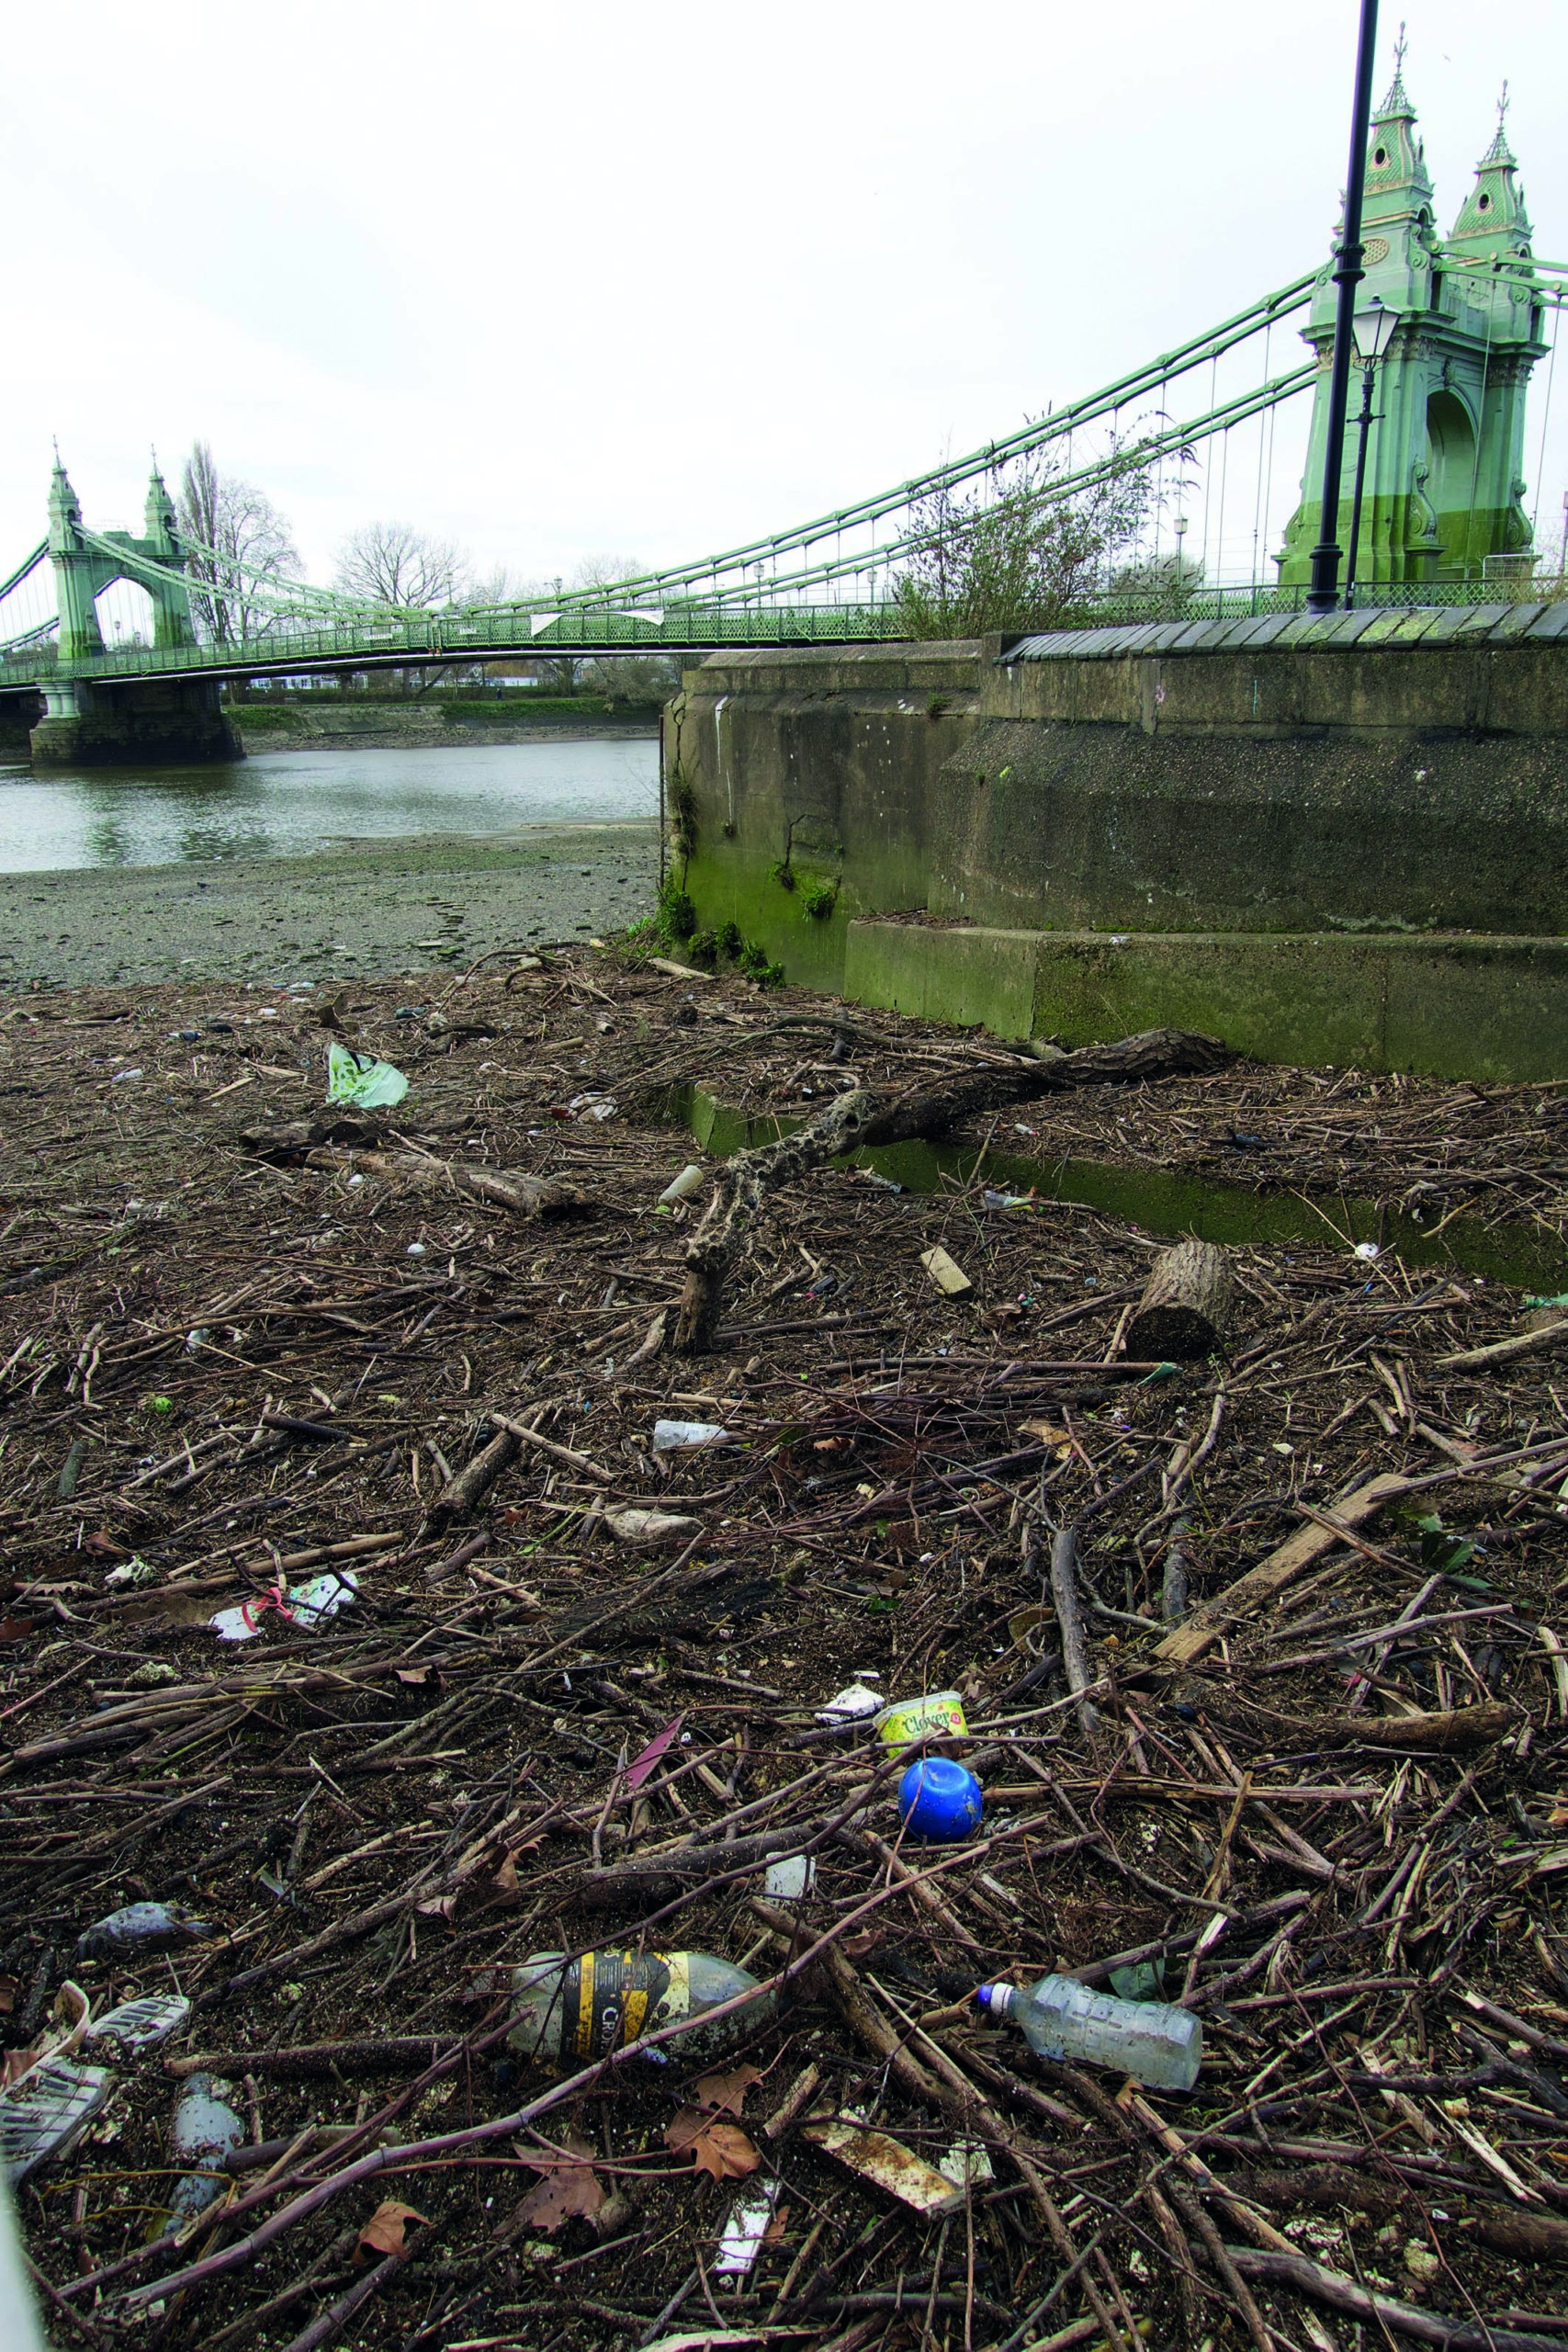
Microplastics are particles less than 5 millimetres long that break off from larger plastics, often consumer products or industrial waste. A few years back, my colleagues and I began investigating how many of these particles were making their way into London’s River Thames. We continued sampling the river every month between May 2019 and May 2021, right through the various lockdowns. We obviously didn’t start the project with COVID in mind, but our work became a useful way to track one environmental impact of the pandemic.
One key finding from our research is that, although there was a 34% decrease in microplastics from pre-COVID levels in the river during lockdown one, levels rose by 77% during the second national lockdown in late 2020 compared to lockdown one.
We suspect this pattern will have been repeated elsewhere, since many of the world’s major rivers pass through rural areas to enter major cities before flowing into the sea. The River Thames can, therefore, be a case study for similar rivers especially within the rest of Europe.
Measuring microplastics
We took three one-litre samples each month at high tide at five points along the Thames in and around London. Our sample sites were Teddington Lock, in an upstream suburb, St Katharine Docks and Limehouse, both in built-up urban areas, and Tilbury and Southend-on-Sea, both downstream of the city.
We then filtered the water and scanned it with a microscope to measure the levels of tiny plastic particles. In all, across the two years, five sites and 354 litres, we found a total of 4,480 microplastics.
That works out to an average of 17.6 pieces per litre. The highest levels were during lockdown two when there were 27.1 pieces per litre.

Microfibres made up 82% of the microplastics overall, and almost all of those we found during lockdown two. These are the most common form of microplastics and usually come from clothing like socks, T-shirts and jumpers made of polyethylene.
Rise caused by face masks
We believe the spike was therefore caused by PPE, especially disposable face masks which are made of a mixture of polyethylene and polypropylene and other types of plastics.
One study found these masks release at least 24,300 microplastic fibres per wash, and if everyone in the UK used one face mask daily for a year, it would produce 66,000 tonnes of unrecyclable and contaminated plastic waste.
This wouldn’t have been such a problem – at least in terms of microplastic pollution – if the masks had been disposed of properly in bins. But unfortunately face masks littered on pavements or left abandoned on public transport became a common sight, while people often accidentally washed their single-use masks. Even reusable masks, which may also be made from plastics, were supposed to be worn and then washed daily according to government guidelines.
Tyre particles decreased consistently over the first two lockdowns as only key workers were permitted to work and travel, and therefore car journeys came down. However, by lockdown three they had risen once again coinciding with hotels, pubs and restaurants reopening.
During the first lockdown, we recorded higher levels of microplastics in Limehouse even as they decreased elsewhere, perhaps as the area is close to a marina with residential and leisure moorings. Teddington recorded high levels of microplastics in between lockdowns, as people were swimming and using boats in the river, which led to authorities barricading the area and its beach.e third lockdown overall microplastic levels had reduced to 5.5 pieces found per litre. However, specific microplastics such as polypropylene, the material recommended in face coverings and PPE, were higher during lockdown three and the post-COVID sample and may be attributed to existing microplastic pollution continuing to breakdown in the water.
By the third lockdown overall microplastic levels had reduced to 5.5 pieces found per litre. However, specific microplastics such as polypropylene, the material recommended in face coverings and PPE, were higher during lockdown three and the post-COVID sample and may be attributed to existing microplastic pollution continuing to breakdown in the water.
Blue fibres increased the most
The most common colours we found throughout this study were blue, black, red and transparent, which is consistent with the microplastics I found when assessing pollution caused by New Year fireworks in London or the particles found in the stomachs of fish in the Thames. However, the sorts of blue fibres released by face masks generally increased throughout the two years of our study. For example, blue fibres increased from 2% of those found in Southend pre-COVID to 30% in lockdown two.
We may not see the full impact of the pandemic on plastic pollution for some years as masks and gloves are continuing to degrade and release particles into the environment. But the good news is that our work has shown that changing public behaviour really can help the environment. It’s an extreme example, but just look at how microplastics decreased in lockdown one.
This article is provided by The Conversation.
- SEO Powered Content & PR Distribution. Get Amplified Today.
- Platoblockchain. Web3 Metaverse Intelligence. Knowledge Amplified. Access Here.
- Minting the Future w Adryenn Ashley. Access Here.
- Source: https://envirotecmagazine.com/2023/04/14/microplastics-77-more-found-in-river-thames-during-lockdown-may-be-due-to-discarded-face-masks-and-ppe/
- :is
- $UP
- 000
- 1
- 2%
- 2019
- 2020
- 2021
- a
- According
- across
- All
- Although
- and
- ARE
- AREA
- areas
- around
- article
- AS
- Assessing
- At
- author
- Authorities
- average
- back
- banners
- BE
- before
- began
- believe
- between
- Black
- Blue
- Break
- Breakdown
- BRIDGE
- by
- CAN
- car
- case
- case study
- Cause
- caused
- changing
- Cities
- City
- Cleaning
- Close
- Clothing
- colleagues
- COM
- come
- Common
- compared
- consistent
- consumer
- Consumer products
- content
- continued
- continuing
- Covid
- COVID-19
- COVID-19 pandemic
- credit
- daily
- Daniel
- decrease
- disabled
- down
- during
- e
- each
- East
- either
- elsewhere
- Emissions
- Enter
- Environment
- environmental
- equipment
- especially
- Europe
- Even
- Every
- everyone
- example
- existing
- extreme
- Face
- face mask
- face masks
- few
- finding
- fireworks
- First
- Fish
- Flowing
- For
- form
- found
- from
- full
- GAS
- generally
- Glance
- good
- greenhouse gas
- Greenhouse gas emissions
- Have
- help
- High
- higher
- highest
- hotels
- How
- However
- HTML
- HTTPS
- i
- image
- Impact
- in
- increased
- industrial
- IT
- ITS
- Journeys
- jpg
- Key
- larger
- Late
- Led
- levels
- light
- like
- likely
- lockdown
- lockdowns
- London
- Look
- Low
- made
- major
- Making
- many
- mask
- Masks
- material
- May..
- measure
- mind
- mixture
- Month
- more
- most
- National
- news
- next
- NIH
- Noise
- of
- on
- ONE
- Other
- overall
- pandemic
- pass
- Pattern
- People
- perhaps
- personal
- pieces
- plastic
- plastics
- plato
- Plato Data Intelligence
- PlatoData
- points
- Pollution
- positive
- PPE
- Problem
- produce
- Products
- project
- properly
- Protective
- provided
- public
- qualified
- recommended
- recorded
- Red
- Reduced
- release
- released
- repeated
- residential
- REST
- Restaurants
- reusable
- Rise
- Risen
- River
- ROSE
- Rural
- Rural Areas
- s
- SEA
- Second
- seemed
- shown
- shutterstock
- Sight
- significant
- similar
- since
- Sites
- some
- Southern
- specific
- spike
- start
- Student
- Study
- such
- supposed
- swimming
- terms
- that
- The
- The Area
- the UK
- their
- therefore
- These
- Third
- three
- Through
- throughout
- Tide
- to
- Total
- track
- transparent
- transport
- travel
- types
- Uk
- university
- urban
- Urban Areas
- usually
- various
- Waste
- Water
- Way..
- which
- while
- will
- with
- within
- Work
- workers
- works
- world’s
- would
- writing
- year
- years
- zephyrnet