- The US Federal Reserve pushed back the first Fed funds rate cut and Fed Chair Powell indicated that the “highly anticipated” March rate cut is not the base case for now.
- The dovish Fed Pivot narrative is still alive as both the 2-year and 10-year Treasury yields continued to inch lower and closed near their session lows.
- The continuation of down-trending US Treasury yields put pressure on JPY carry trades indirectly; AUD/JPY is the worst performing among the G-10 currencies so far.
This is a follow-up analysis of our prior report, “NZD/JPY: JPY crosses under downside pressure after BoJ’s hawkish guidance” published on 24 January 2024. Click here for a recap.
The US Federal Reserve left its Fed funds rate unchanged at 5.25% to 5.50%, a 22-year high for the fourth consecutive FOMC meeting yesterday and reinforced the guidance that it has likely reached the peak of its current interest rate hike cycle via including a new reference to considering “any adjustments” to the Fed funds rate on its latest monetary policy statement, a shift away from its previous tightening bias.
In addition, Fed officials have thrown cold water to the earlier much anticipated March’s first Fed funds rate cut (from around 70% chance priced-in earlier a month ago to a current 35% odds by the 30-day Fed funds rate futures according to CME FedWatch Tool). They have signaled that a rate cut in the March FOMC meeting is unlikely as such a move is not appropriate until they gain more confidence that inflation is moving sustainably towards 2%.
However, the dovish Fed Pivot narrative for 2024 has not been totally “killed off”. During the Q&A session of the FOMC press conference, Fed Chair Powell painted a balanced tonality on the timing and pace of the upcoming expected interest rate cut cycle.
Dovish Fed Pivot is still alive & JPY carry trades are losing positive carry

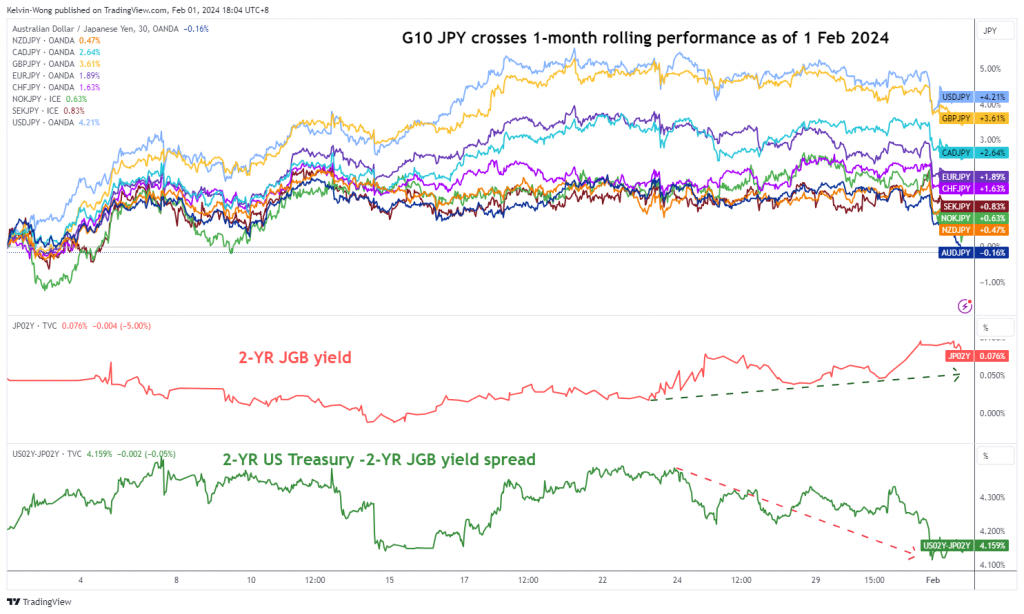
Fig 1: 1-month rolling performances of G-10 JPY crosses as of 1 Feb 2024 (Source: TradingView, click to enlarge chart)
The net effect is liquidity conditions are not being squeezed tightly as the Fed’s monetary policy-sensitive 2-year US Treasury yield ended yesterday, 31 January US session near its session low at 4.21% (-13 bps), and similar observations can be seen in the 10-year Treasury yield, the benchmark for long-term funding rate as it closed down by -12 bps to 3.92%, and traded below its 200-day moving average for the third consecutive day.
Given that the US Fed is still on the path of embarking on an accommodating monetary policy with the first interest rate cut now being pushed further to May’s FOMC (62% chance now at this time of the writing, up from 50% chance priced in a week ago according to the CME FedWatch Tool), in contrast to the Bank of Japan’s recent hawkish guidance on the “soon to be removed” short-term negative interest rates in Japan.
Hence, the 2-year US Treasury yield premium over the 2-year Japanese Government Bond (JGB) has continued to shrink significantly to trade now at 4.15%, a 10-month low from a high of 5.16% printed in mid-October 2023.
The persistent bout of US Treasury-JGB yield premium shrinkage has continued to put downside pressure on long-biased JPY-denominated carry trades in the foreign market as the positive carry diminishes due to higher funding costs as well from a rising 2-year JGB yield since mid-January 2024 (from 0% to 0.08%).
Among the G-10 JPY crosses, the worst hit so far is the AUD/JPY (-0.2%) based on a 1-month rolling performance basis (see Fig 1).
AUD/JPY bearish breakdown below 50-day moving average
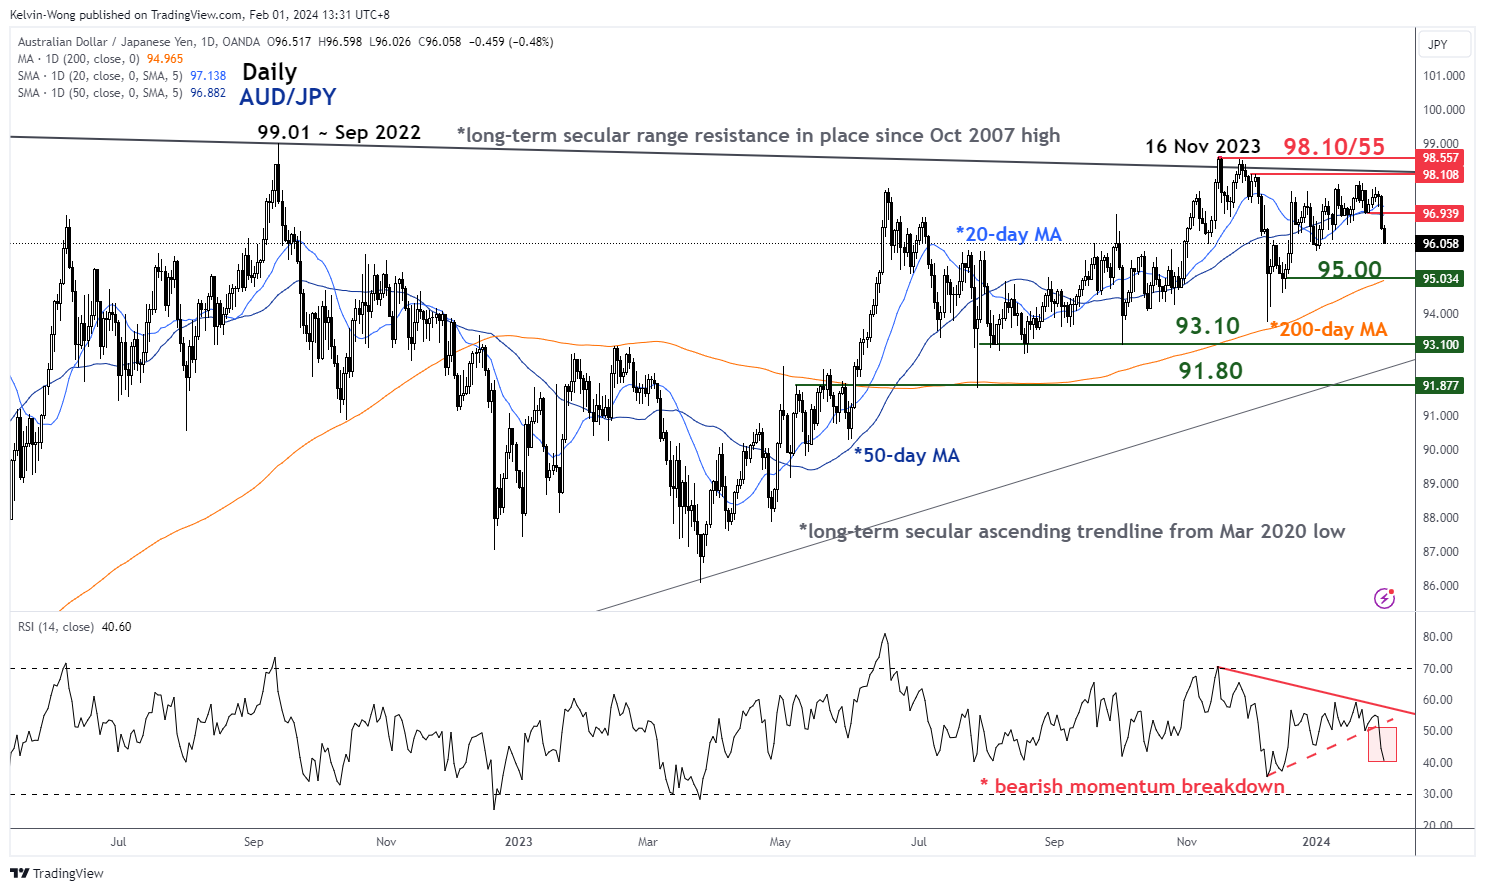
Fig 2: AUD/JPY medium-term trend as of 1 Feb 2024 (Source: TradingView, click to enlarge chart)
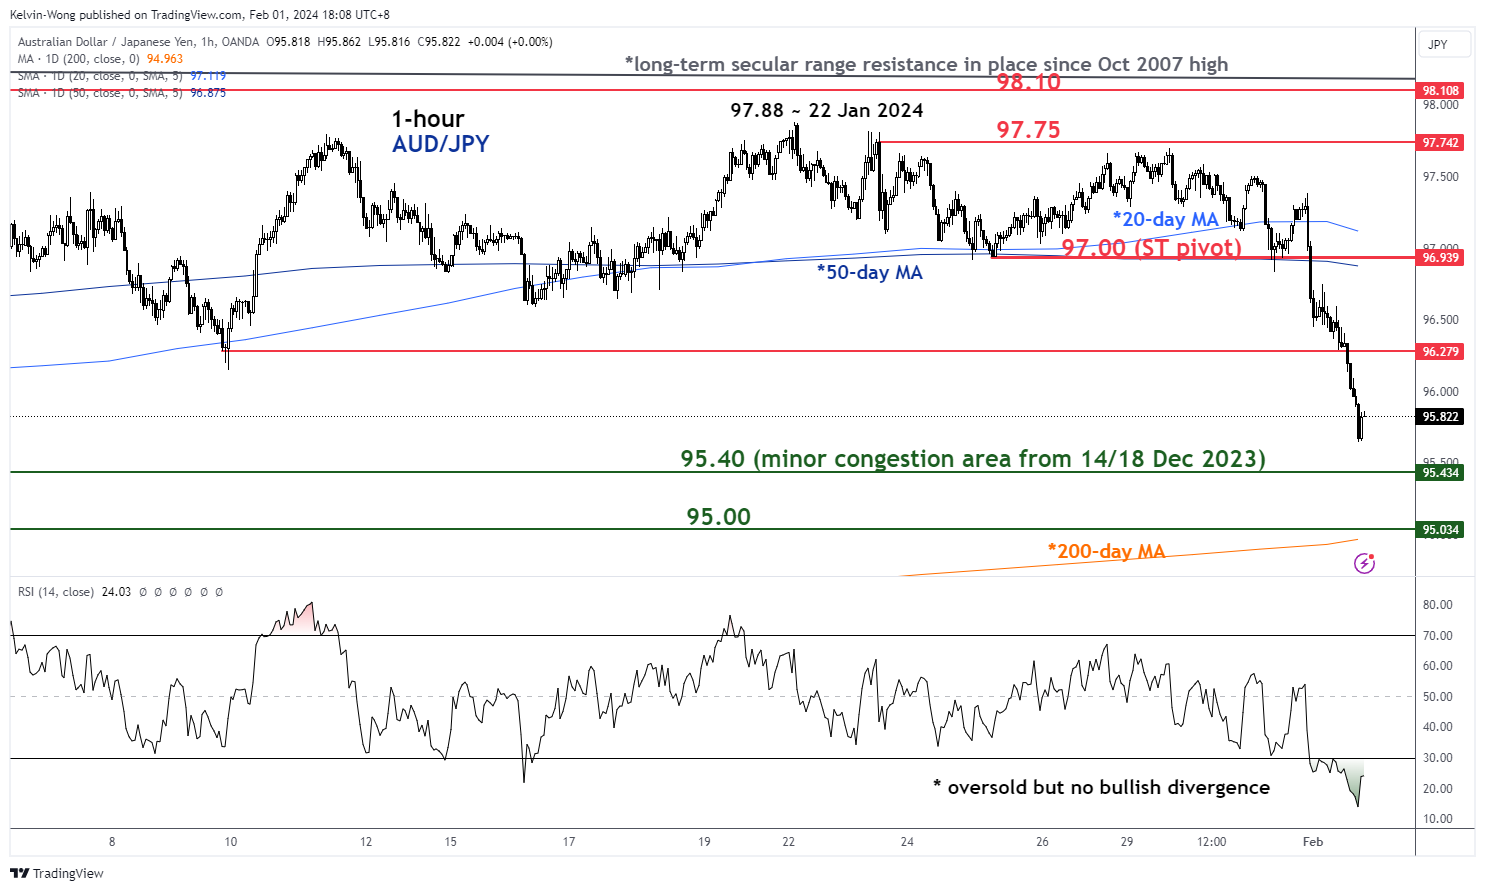
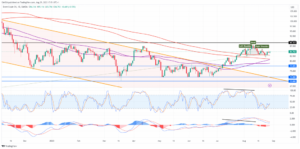
Fig 3: AUD/JPY short-term trend as of 1 Feb 2024 (Source: TradingView, click to enlarge chart)
After a recent retest close to the 98.10 long-term secular range resistance from the October 2007 swing high on 22 January 2024 (printed an intraday high of 97.88), the momentum has been bearish on the AUD/JPY as illustrated by the downward sloping daily RSI momentum indicator.
Yesterday’s price action has broken below the 20-day and 50-day moving averages which reinforces at least a short to medium-term negative feedback loop into the AUD/JPY.
Right now, the hourly RSI momentum indicator has collapsed into its oversold region (without any clear bullish divergence condition) after a rapid decline inflicted during today’s 1 February Asian session which in turn may see a minor snap-back rebound for AUD/JPY towards around the near-term resistance at 96.30.
If the 97.00 key short-term pivotal resistance is not surpassed to the upside, the odds are still skewed towards the bearish side for AUD/JPY to expose the next intermediate supports at 95.40 and 95.00 (also the 200-day moving average) in the first step.
However, a clearance above 97.00 invalidates the bearish tone for AUD/JPY to see the next intermediate resistance coming in at 97.75.
Content is for general information purposes only. It is not investment advice or a solution to buy or sell securities. Opinions are the authors; not necessarily that of OANDA Business Information & Services, Inc. or any of its affiliates, subsidiaries, officers or directors. If you would like to reproduce or redistribute any of the content found on MarketPulse, an award winning forex, commodities and global indices analysis and news site service produced by OANDA Business Information & Services, Inc., please access the RSS feed or contact us at info@marketpulse.com. Visit https://www.marketpulse.com/ to find out more about the beat of the global markets. © 2023 OANDA Business Information & Services Inc.
Latest posts by Kelvin Wong (see all)
- SEO Powered Content & PR Distribution. Get Amplified Today.
- PlatoData.Network Vertical Generative Ai. Empower Yourself. Access Here.
- PlatoAiStream. Web3 Intelligence. Knowledge Amplified. Access Here.
- PlatoESG. Carbon, CleanTech, Energy, Environment, Solar, Waste Management. Access Here.
- PlatoHealth. Biotech and Clinical Trials Intelligence. Access Here.
- Source: https://www.marketpulse.com/forex/jpy-carry-trades-downside-pressure-reinforced-ex-post-fomc/kwong
- :has
- :is
- :not
- $UP
- 1
- 10
- 10-year Treasury yields
- 15 years
- 15%
- 2%
- 2023
- 2024
- 22
- 24
- 30
- 31
- 35%
- 40
- 420
- 700
- 75
- 97
- 98
- a
- About
- above
- access
- According
- Action
- addition
- advice
- affiliates
- After
- ago
- alive
- also
- among
- an
- analyses
- analysis
- and
- Anticipated
- any
- appropriate
- ARE
- around
- AS
- asian
- At
- AUD/JPY
- author
- authors
- avatar
- average
- award
- away
- back
- Balanced
- Bank
- base
- based
- basis
- BE
- bearish
- beat
- been
- being
- below
- Benchmark
- bias
- bond
- both
- Box
- Breakdown
- Broken
- Bullish
- bullish divergence
- business
- buttons
- buy
- by
- CAN
- carry
- case
- Chair
- Chance
- Chart
- clear
- clearance
- click
- Close
- closed
- CME
- cold
- collapsed
- COM
- combination
- coming
- Commodities
- condition
- conditions
- conducted
- Conference
- confidence
- Connecting
- consecutive
- considering
- contact
- content
- continuation
- continued
- contrast
- Costs
- courses
- currencies
- Current
- Cut
- cycle
- daily
- day
- Decline
- Directors
- Divergence
- Dovish
- down
- downside
- downward
- due
- during
- Earlier
- effect
- Elliott
- ended
- enlarge
- Ether (ETH)
- exchange
- expected
- experience
- expert
- far
- Feb
- February
- Fed
- Fed Chair
- Fed Chair Powell
- fed funds rate
- Federal
- federal reserve
- feedback
- Fig
- financial
- Find
- First
- flow
- FOMC
- For
- foreign
- foreign exchange
- forex
- found
- Fourth
- from
- fund
- fundamental
- funding
- funds
- further
- Futures
- Gain
- General
- Global
- global markets
- Government
- guidance
- Have
- Hawkish
- High
- higher
- Hike
- Hit
- HTTPS
- if
- in
- Inc.
- Including
- indicated
- Indicator
- Indices
- indirectly
- inflation
- information
- interest
- INTEREST RATE
- interest rate hike
- Interest Rates
- Intermediate
- into
- investment
- IT
- ITS
- January
- Japan
- Japan’s
- Japanese
- JGB
- JPY
- Kelvin
- Key
- Last
- latest
- least
- left
- levels
- like
- likely
- Liquidity
- long-term
- losing
- Low
- lower
- Lows
- Macro
- March
- Market
- market outlook
- market research
- MarketPulse
- Markets
- max-width
- May..
- meeting
- minor
- Momentum
- Monetary
- Monetary Policy
- Month
- more
- move
- moving
- moving average
- moving averages
- much
- NARRATIVE
- Near
- necessarily
- negative
- negative interest rates
- net
- New
- news
- next
- now
- numerous
- observations
- october
- Odds
- of
- officers
- officials
- on
- only
- Opinions
- or
- our
- out
- Outlook
- over
- Pace
- passionate
- path
- Peak
- performance
- performances
- performing
- perspectives
- photo
- Pivot
- pivotal
- plato
- Plato Data Intelligence
- PlatoData
- please
- policy
- positioning
- positive
- Posts
- Powell
- Premium
- press
- pressure
- previous
- price
- PRICE ACTION
- Prior
- Produced
- providing
- published
- purposes
- pushed
- put
- Q&A
- range
- rapid
- Rate
- Rate Hike
- Rates
- reached
- rebound
- recap
- recent
- reference
- region
- reinforces
- research
- Reserve
- Resistance
- retail
- Reversal
- rising
- Rolling
- rsi
- rss
- Securities
- see
- seen
- sell
- senior
- service
- Services
- session
- sharing
- shift
- Short
- short-term
- side
- significantly
- similar
- since
- Singapore
- site
- So
- so Far
- solution
- Source
- specializing
- Statement
- Step
- Still
- stock
- Stock markets
- Strategist
- subsidiaries
- such
- Supports
- surpassed
- sustainably
- Swing
- Technical
- Technical Analysis
- ten
- that
- The
- the Fed
- their
- they
- Third
- this
- thousands
- tightening
- tightly
- time
- timing
- to
- today’s
- TONE
- tool
- TOTALLY
- towards
- trade
- traded
- Traders
- trades
- Trading
- TradingView
- Training
- treasury
- Treasury yields
- Trend
- TURN
- under
- unique
- unlikely
- until
- upcoming
- Upside
- us
- us fed
- US Federal
- us federal reserve
- US Treasury
- US treasury yields
- using
- v1
- via
- Visit
- Water
- Wave
- week
- WELL
- which
- winning
- with
- without
- wong
- Worst
- would
- writing
- years
- yesterday
- Yield
- yields
- you
- zephyrnet