The Ethereum price breakout from $2143 resistance offers buyers an opportunity to prolong recovery trend
<!–
–>
Published 6 hours ago

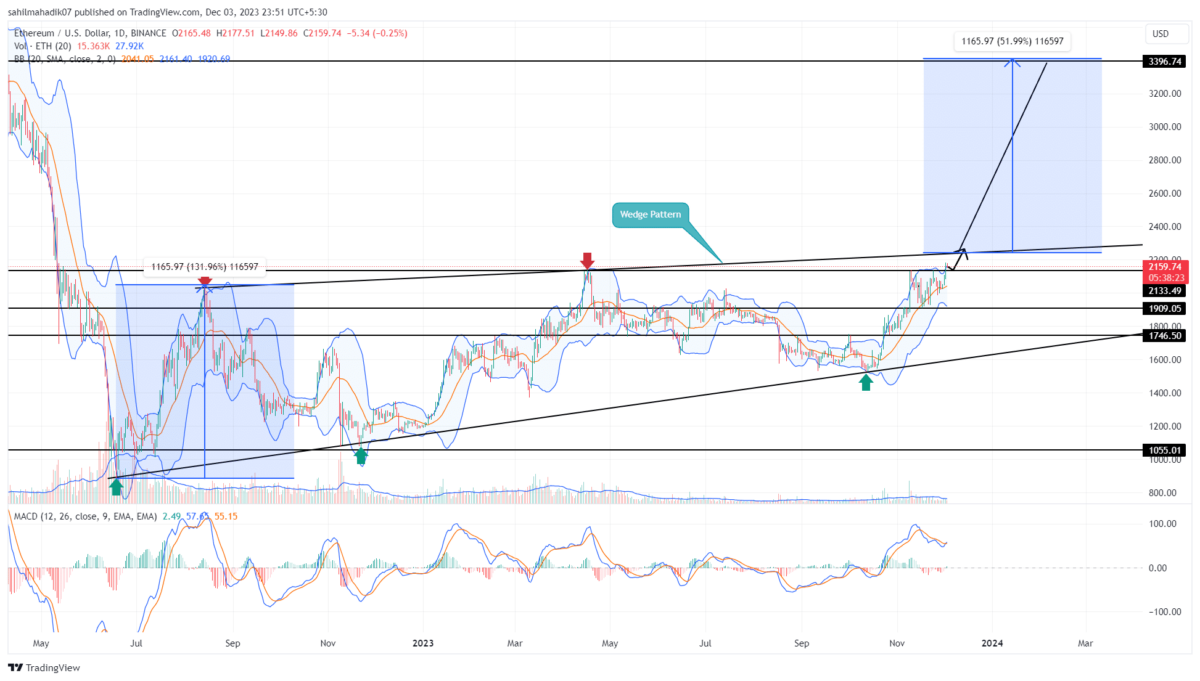
In November, the Ethereum (ETH) coin exhibited a sideways trend, oscillating between the horizontal levels of $2,143 and $1,910. This period of consolidation, while indicative of market uncertainty, may also be a phase for buyers to regroup and revitalize the previously waning bullish momentum. A notable breakout above the upper resistance level could potentially amplify buying activity and extend the ongoing recovery trend.
advertisement
<!–
adClient.showBannerAd({
adUnitId: “856eec25-5bac-4623-9cc6-5827ff47c238”,
containerId: “market-banner-ad-mobile”
});
–>
Also Read: Bitcoin & Ethereum Options Data Indicates Roadblock Ahead
Will ETH Price Hit $3000?
- A bullish breakout from the wedge pattern would set a directional uptrend
- The rising price could face intense supply around $2250.
- The intraday trading volume in Ether is $10.2 Billion, indicating a 78% gain.
Coinciding with the Bitcoin price ascent over the $38,000 mark, a renewed sense of optimism has begun to permeate the crypto market. Responding to this positive shift, the ETH price rebounded from the psychologically significant $2,000 mark, registering a 7.8% weekly increase to its current trading price of $2,153.
During this rally, the Ethereum price surpassed the immediate resistance of $2,133, suggesting that buyers are poised to drive the price even higher. Despite a modest intraday loss of 0.5%, a retest of this breached resistance could confirm its role as a new support level, underpinning the buyer’s ability to sustain higher price levels.
However, with only a 3.5% increase, the ETH price is approaching a significant resistance level formed by the wedge pattern. Historical trends indicate that this trendline has often led to increased selling pressure and notable price declines.
Therefore, a conclusive breakout above this barrier is crucial for confirming a more robust uptrend. Should the Ethereum price successfully navigate this challenge, its price could potentially soar by 50%, reaching around $3,400.
BTC vs ETH Performance
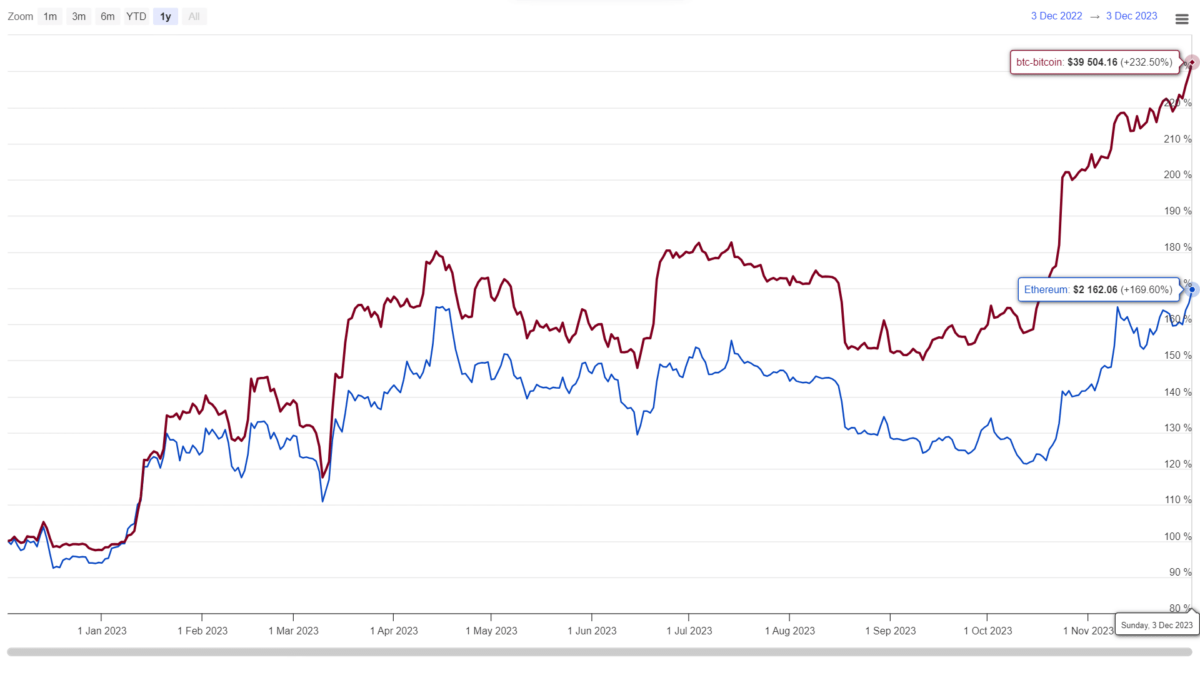
Long-term comparative analysis between Bitcoin and Ethereum reveals that both cryptocurrencies gained considerable momentum since mid-October. However, the Bitcoin price has demonstrated a more substantial recovery, characterized by a consistent pattern of higher highs and lows. On the other hand, the ETH price has faced some challenges, particularly noticeable supply pressure around the $2,200 mark.
- Bollinger band: The uptick in the Bollinger band indicator reflects that buyers are aggressive and ready to buy ETH at a higher price.
- Moving Average Convergence Divergence: a bullish crossover between the MACD(blue) and signal(orange) line, accentuates a recovery sentiment return in this asset.
advertisement
The presented content may include the personal opinion of the author and is subject to market condition. Do your market research before investing in cryptocurrencies. The author or the publication does not hold any responsibility for your personal financial loss.
<!– Close Story–>
- SEO Powered Content & PR Distribution. Get Amplified Today.
- PlatoData.Network Vertical Generative Ai. Empower Yourself. Access Here.
- PlatoAiStream. Web3 Intelligence. Knowledge Amplified. Access Here.
- PlatoESG. Carbon, CleanTech, Energy, Environment, Solar, Waste Management. Access Here.
- PlatoHealth. Biotech and Clinical Trials Intelligence. Access Here.
- Source: https://coingape.com/markets/is-ethereum-price-rally-to-3000-a-realistic-december-target/
- :has
- :is
- :not
- :where
- $3
- 000
- 1
- 12
- 13
- 150
- 200
- 22
- 40
- 400
- 50
- 7
- 72
- 9
- a
- ability
- above
- accentuates
- activity
- Ad
- Ads
- aggressive
- ago
- also
- amplify
- an
- analysis
- and
- any
- approaching
- ARE
- armed
- around
- article
- AS
- ascent
- asset
- Assets
- At
- author
- avatar
- average
- BAND
- barrier
- BE
- before
- begun
- between
- Billion
- Bitcoin
- bitcoin and ethereum
- Bitcoin Price
- Bitcoin vs Ethereum
- Blue
- bons
- Bonus
- both
- breakout
- BTC
- Bullish
- buy
- buyers
- Buying
- by
- challenge
- challenges
- characterized
- Coin
- Coingape
- condition
- Confirm
- considerable
- consistent
- consolidation
- content
- continues
- Convergence
- could
- crucial
- crypto
- Crypto Market
- cryptocurrencies
- cryptocurrency
- Current
- daily
- data
- December
- Declines
- dedicated
- demonstrated
- Despite
- Divergence
- do
- does
- drawn
- drive
- driven
- embraced
- emerging
- ETH
- eth price
- Ether
- Ether (ETH)
- ethereum
- ethereum (ETH)
- Ethereum Options
- Ethereum Price
- Even
- exhibited
- experience
- explore
- extend
- eye
- Face
- faced
- financial
- Financial Instruments
- For
- formed
- from
- Gain
- gained
- grasp
- hand
- he
- High
- higher
- Highs
- his
- historical
- Hit
- hold
- Horizontal
- HOURS
- However
- HTTPS
- immediate
- in
- include
- Increase
- increased
- indicate
- indicates
- indicating
- indicative
- Indices
- instruments
- investing
- ITS
- Led
- Level
- levels
- Line
- loss
- Lows
- mark
- Market
- market research
- Markets
- May..
- modest
- Momentum
- more
- movements
- Navigate
- New
- notable
- November
- of
- Offers
- often
- on
- ongoing
- only
- Opinion
- opportunities
- Opportunity
- Optimism
- Options
- or
- Orange
- Other
- over
- particularly
- passion
- Pattern
- period
- personal
- phase
- photo
- PHP
- plato
- Plato Data Intelligence
- PlatoData
- plugin
- poised
- positive
- potentially
- presented
- pressure
- previously
- price
- price rally
- Publication
- rally
- reaching
- Read
- ready
- realistic
- realm
- recovery
- reflects
- registering
- renewed
- research
- Resistance
- responding
- responsibility
- return
- Reveals
- rising
- robust
- Role
- Selling
- sense
- sentiment
- set
- Share
- shift
- should
- significant
- since
- some
- strong
- subject
- substantial
- Successfully
- supply
- support
- support level
- surpassed
- Target
- Technical
- Technical Analysis
- that
- The
- this
- three
- to
- top
- trader
- Trading
- trading volume
- TradingView
- Trend
- Trends
- Uncertainty
- underpinning
- uptrend
- volume
- vs
- weekly
- while
- with
- would
- years
- Your
- zephyrnet