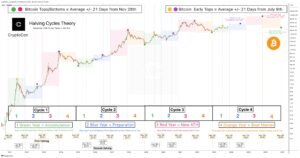
In its new monthly report titled “The Bitcoin Monthly: Bitcoin Battles Resistance Around Its On-Chain Mean”, Ark Invest has provided an exhaustive analysis of the current market landscape. The report categorizes its findings into bullish, neutral, and bearish perspectives, providing a holistic view of Bitcoin’s current and potential future stance.
Bullish Arguments For Bitcoin
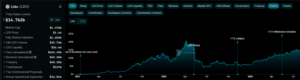
Grayscale Spot ETF and GBTC’s Discount To NAV: On August 29, a pivotal decision was made by a US Federal Appeals Court. They ruled that the U.S. Securities and Exchange Commission (SEC) must revisit and reconsider its earlier rejection of the Grayscale Bitcoin Trust’s (GBTC) application to transition into a spot ETF. This legal development saw GBTC’s discount to NAV shift from -24% to -18% on the same day, indicating heightened market optimism. By the end of August, GBTC was at a discount-to-NAV of -20.6%.
Bitcoin’s General Cost Basis Recovery: Bitcoin’s realized capitalization, which encompasses both its primary (miners) and secondary (investors) markets, is a measure of the aggregate cost basis of BTC. Between Q4 2022 and Q1 2023, the realized cap drawdown stood at -19%, marking its steepest since 2012. This drawdown serves as a barometer for capital outflows from the network.
Ark’s analysis suggests that the deeper the drawdown, the higher the likelihood of Bitcoin holders exiting the market, potentially setting the stage for a more robust bull market. The realized cap has improved from its all-time high in 2021, moving from a 19% low post the FTX collapse in November 2022 to 15.6%, indicating capital inflows over the past 8 months.
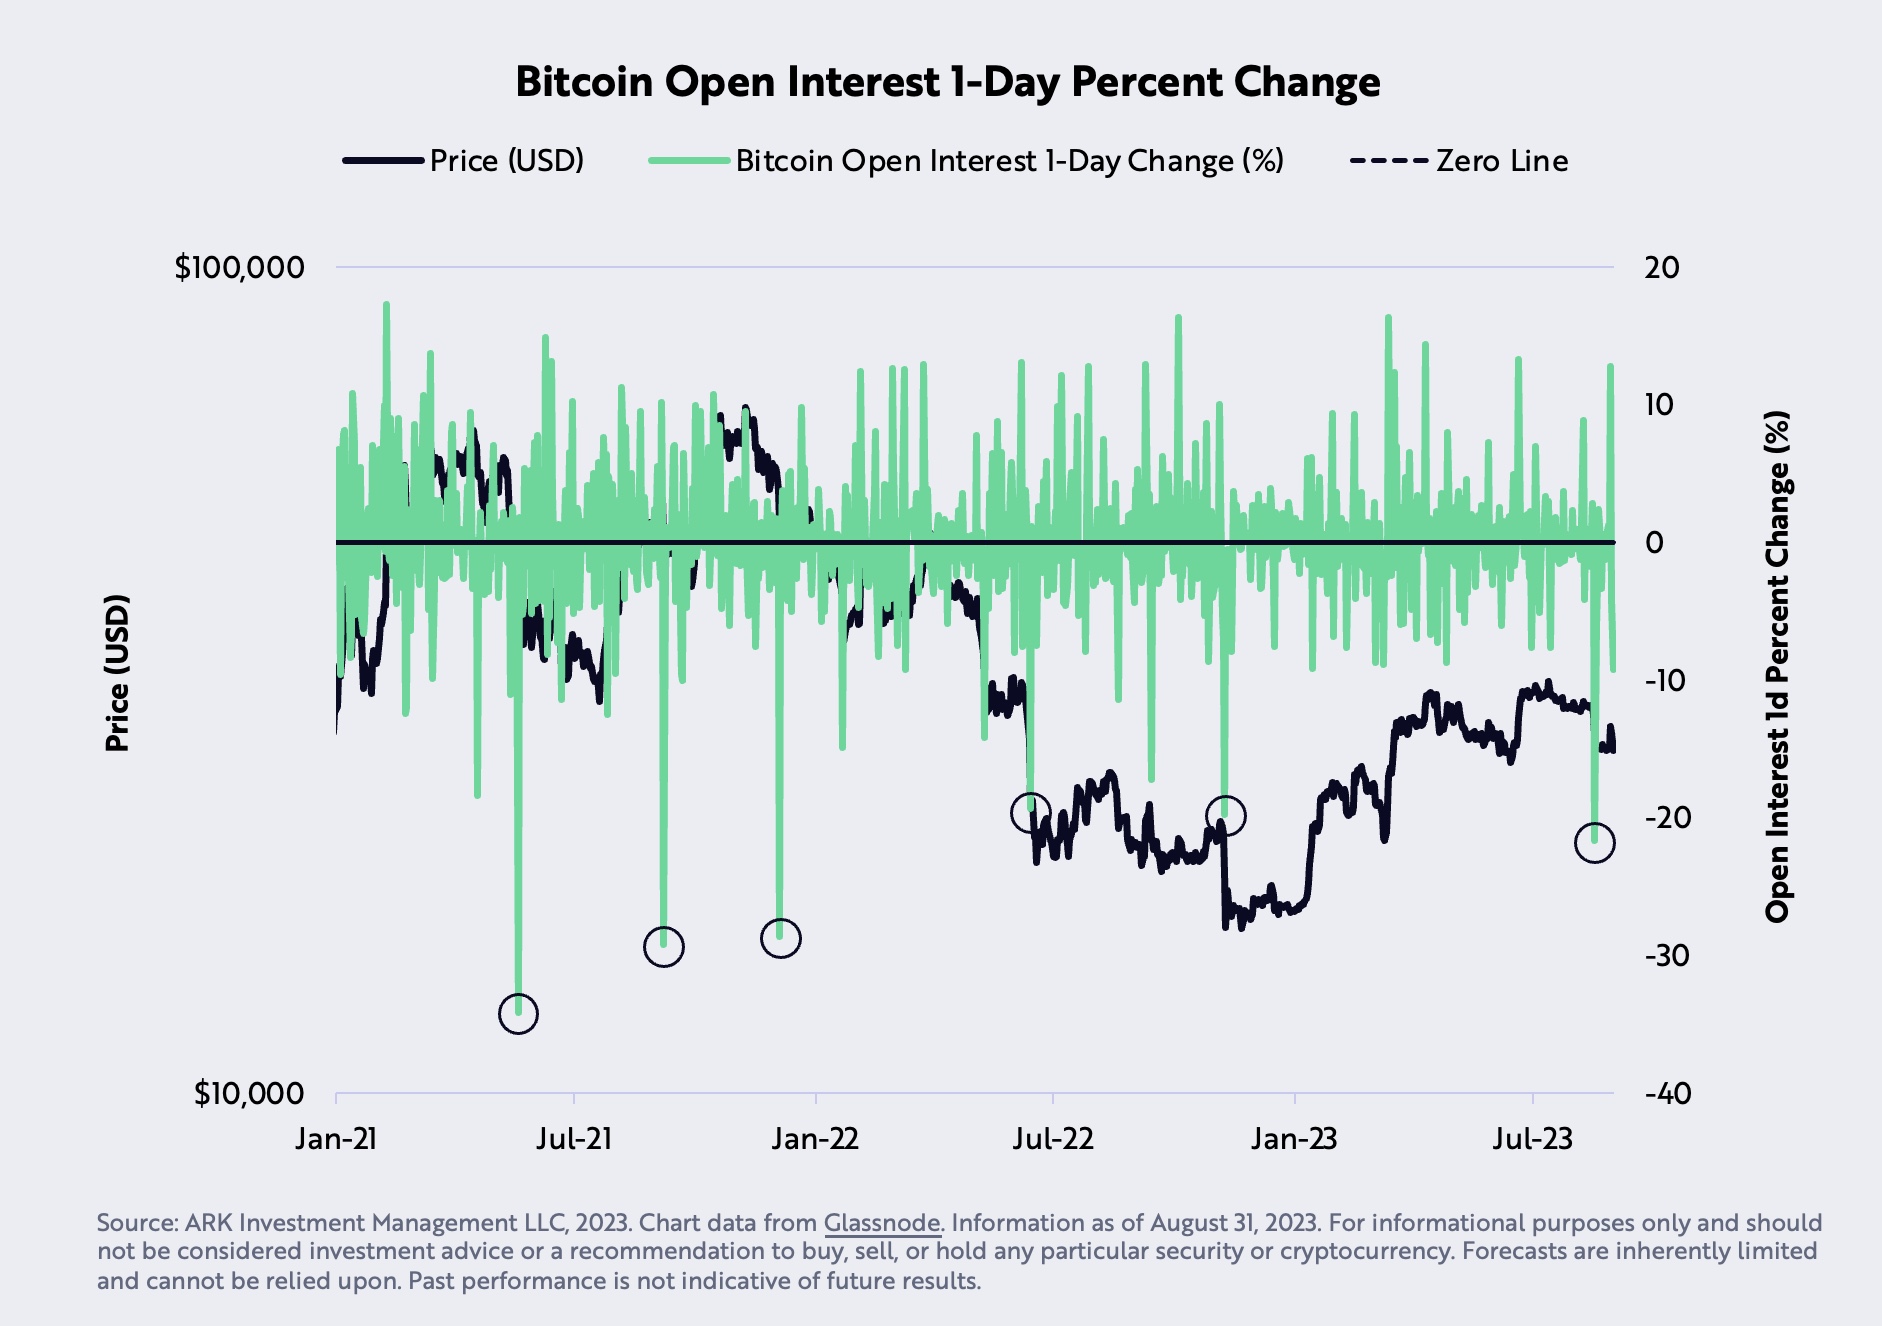
Futures Open Interest Collapse: August 17 witnessed a rapid liquidation of Bitcoin futures by 21.7%, the swiftest since December 2021. Ark Invest interprets this price correction as a “cathartic sentiment correction.”
Neutral Arguments
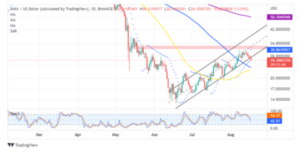
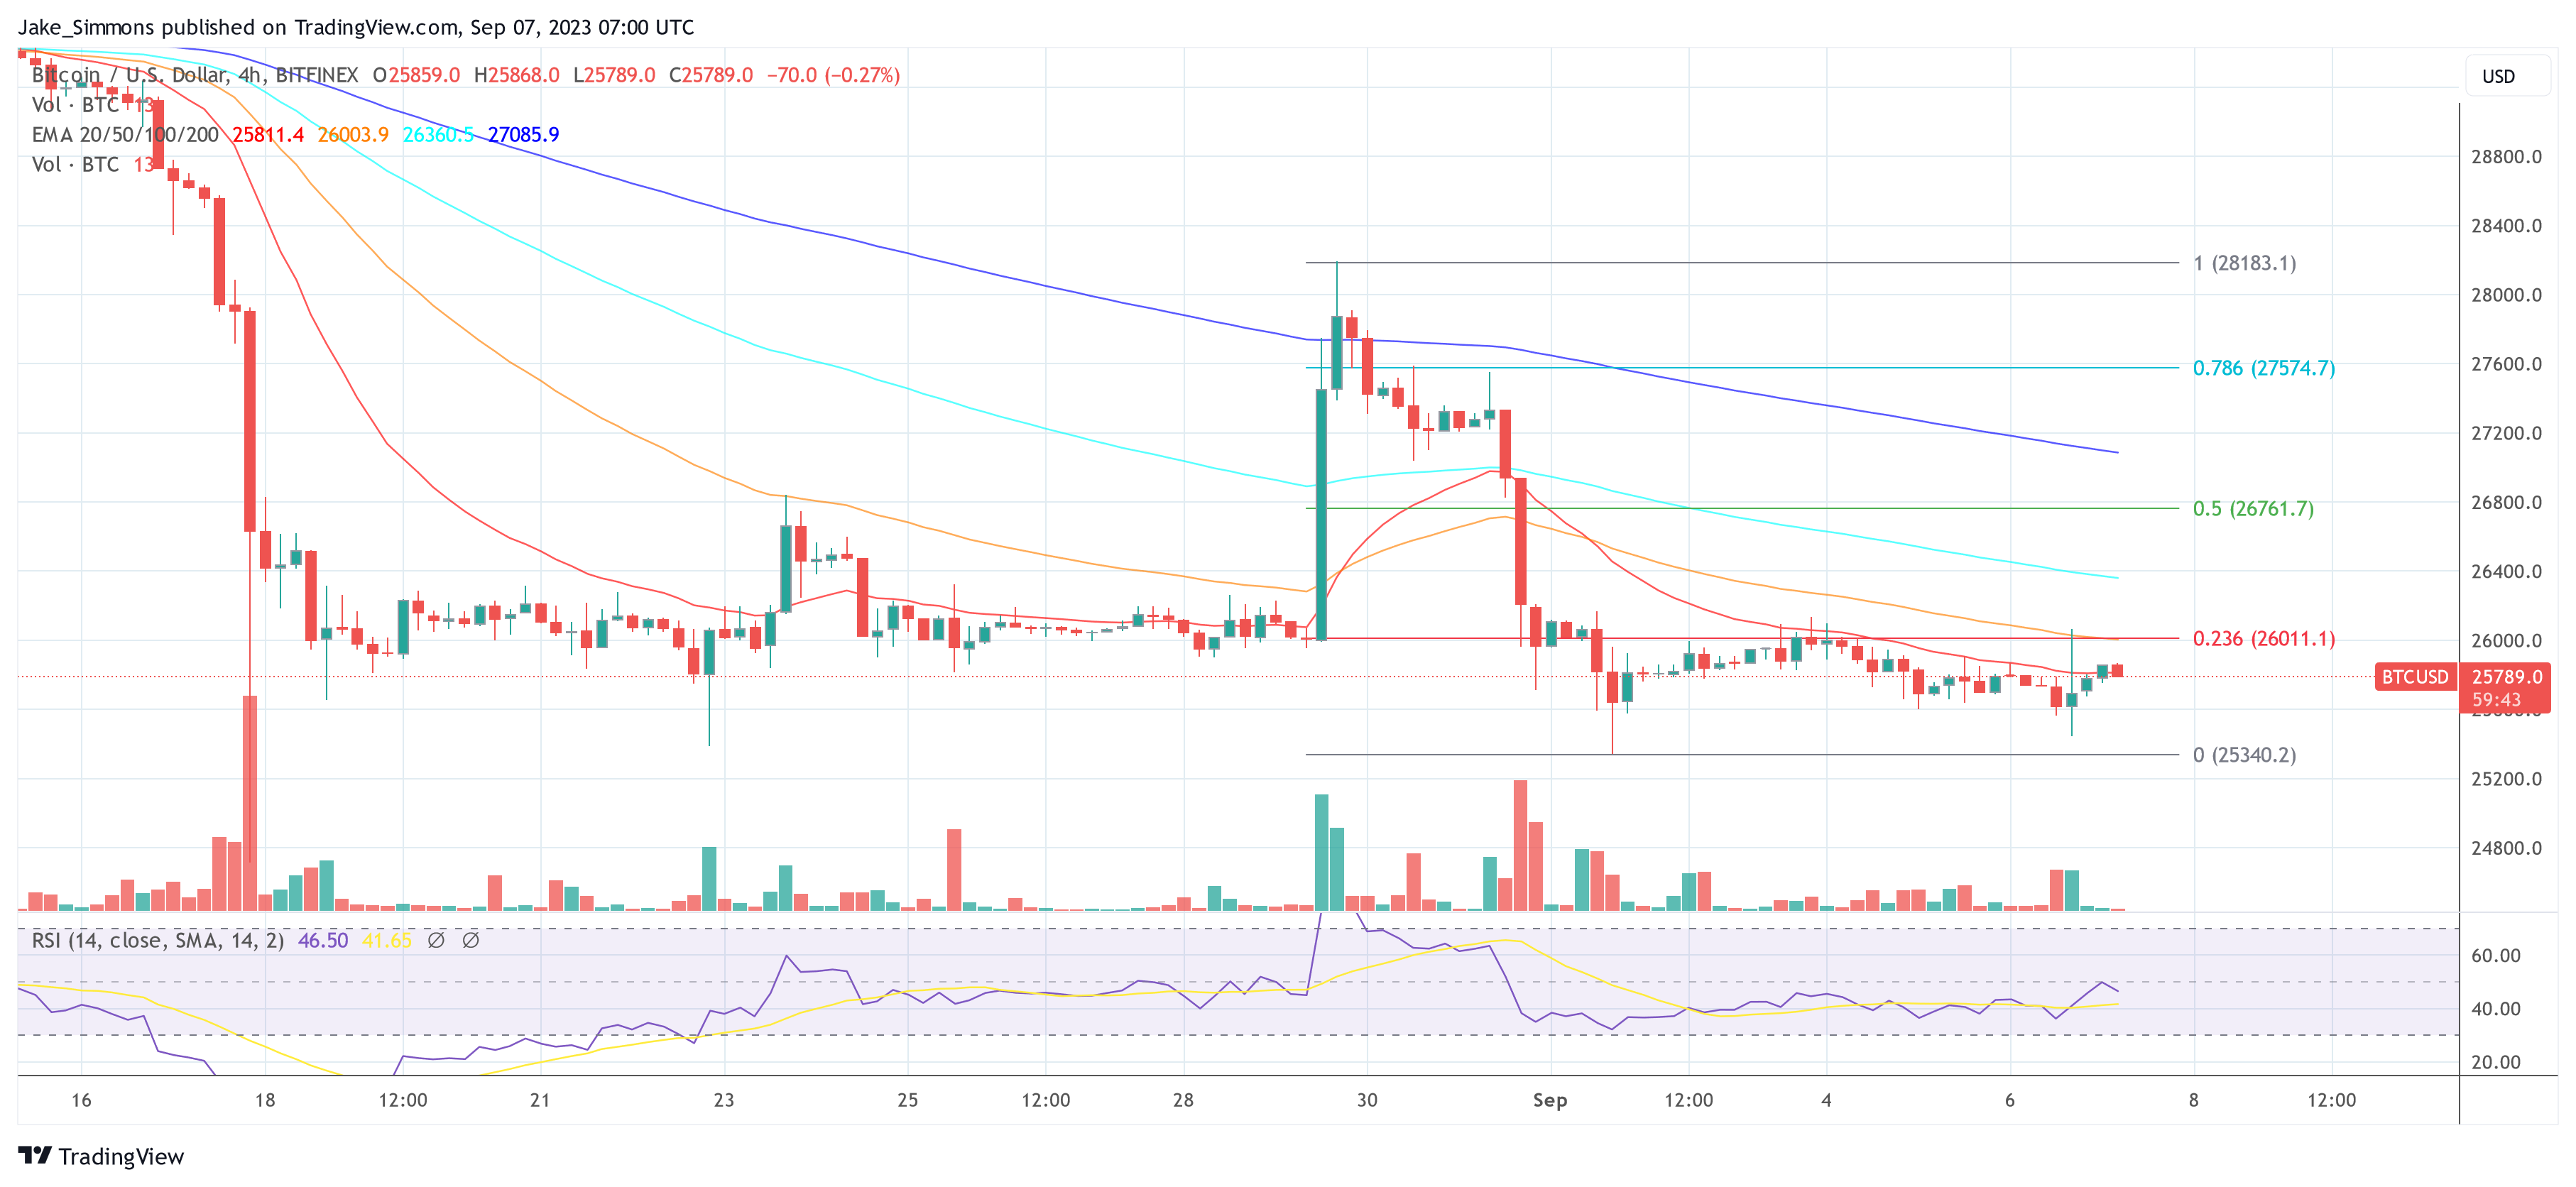
Bitcoin Price and the 200-Week Moving Average: August was a challenging month for Bitcoin as its price dipped by 5.4%, settling below its 200-week moving average at $27,580. This was the first instance since June 2023. However, Ark Invest posits that Bitcoin should find substantial downside support at its realized price of $20,300.
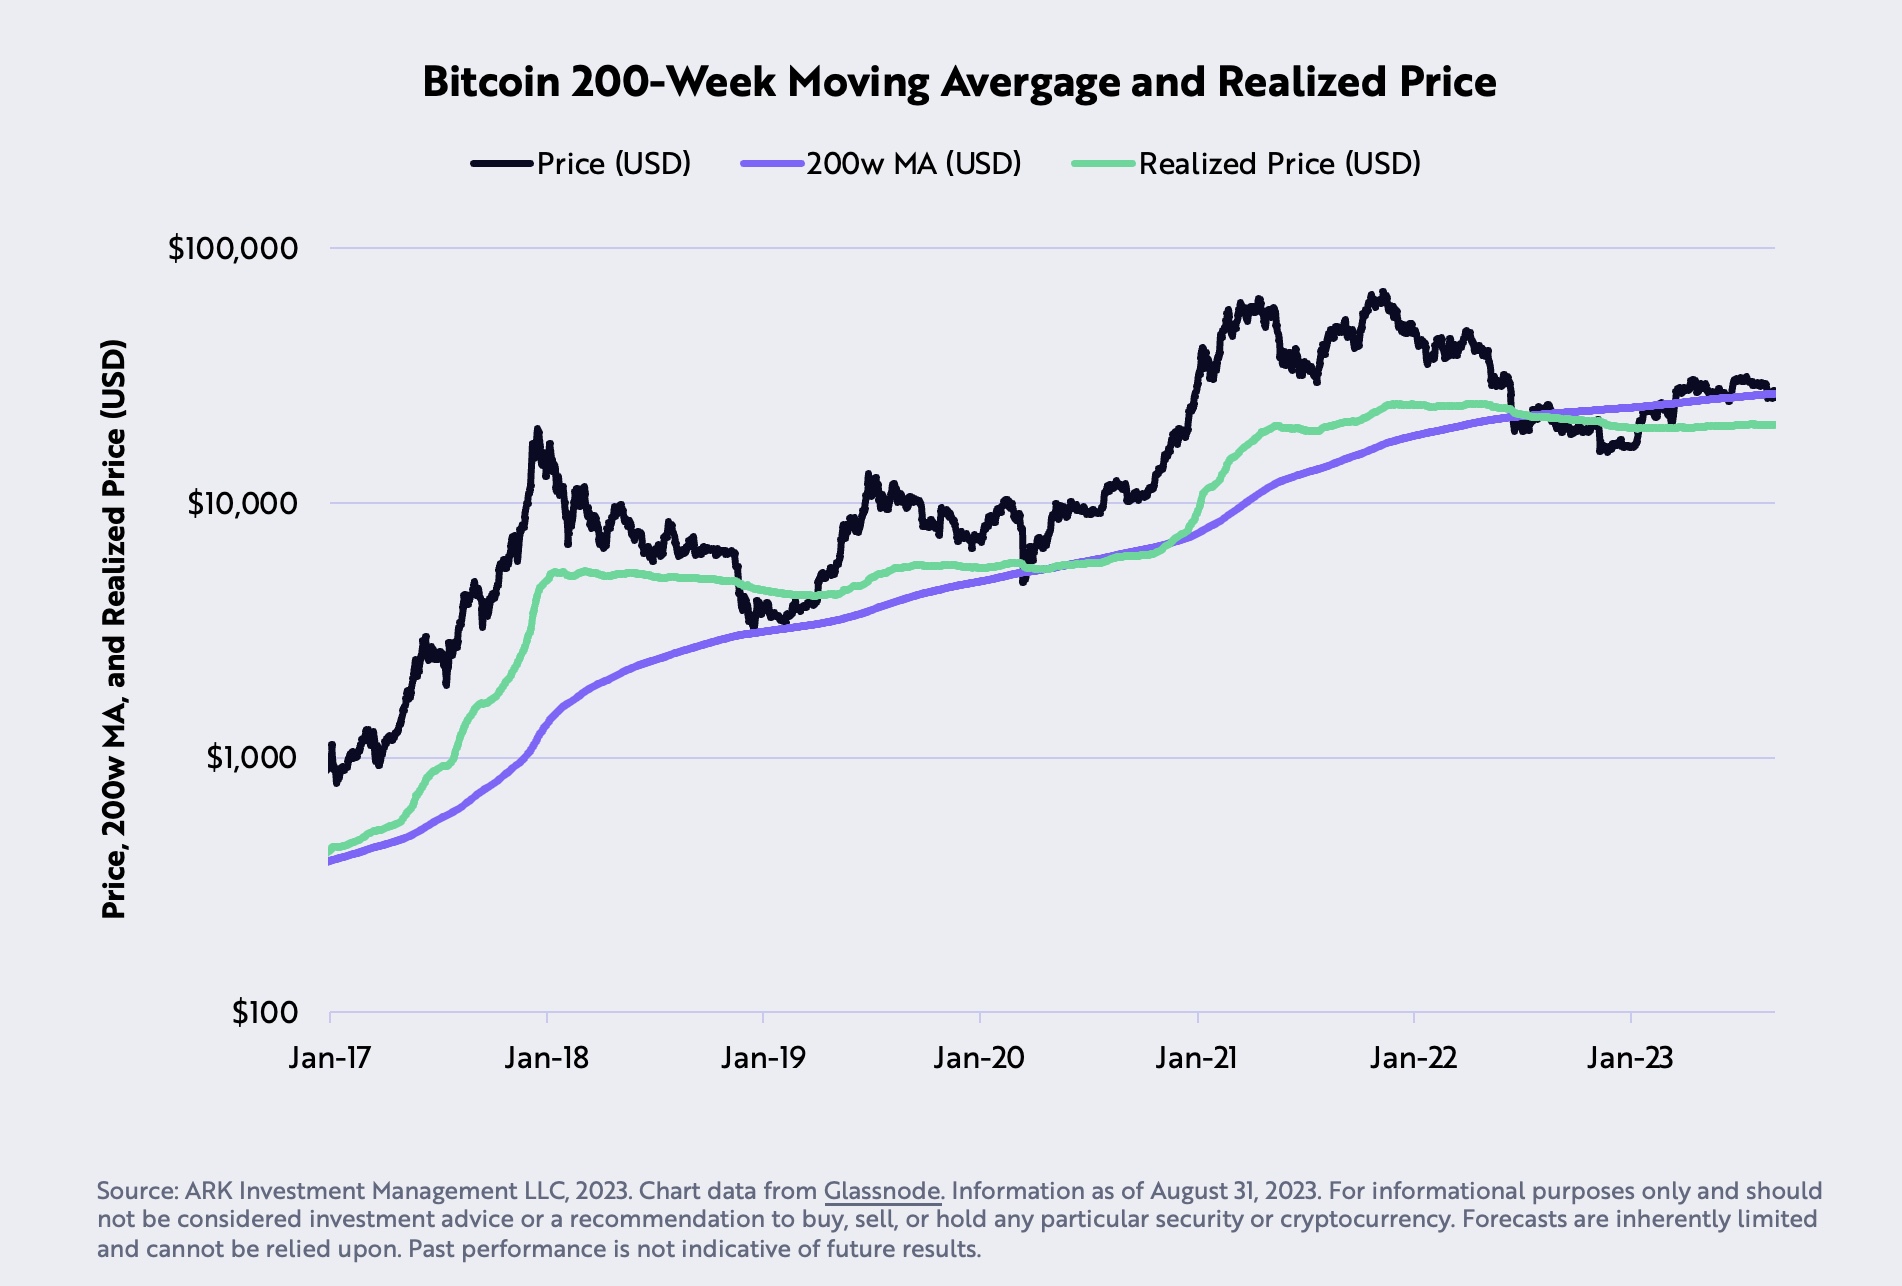
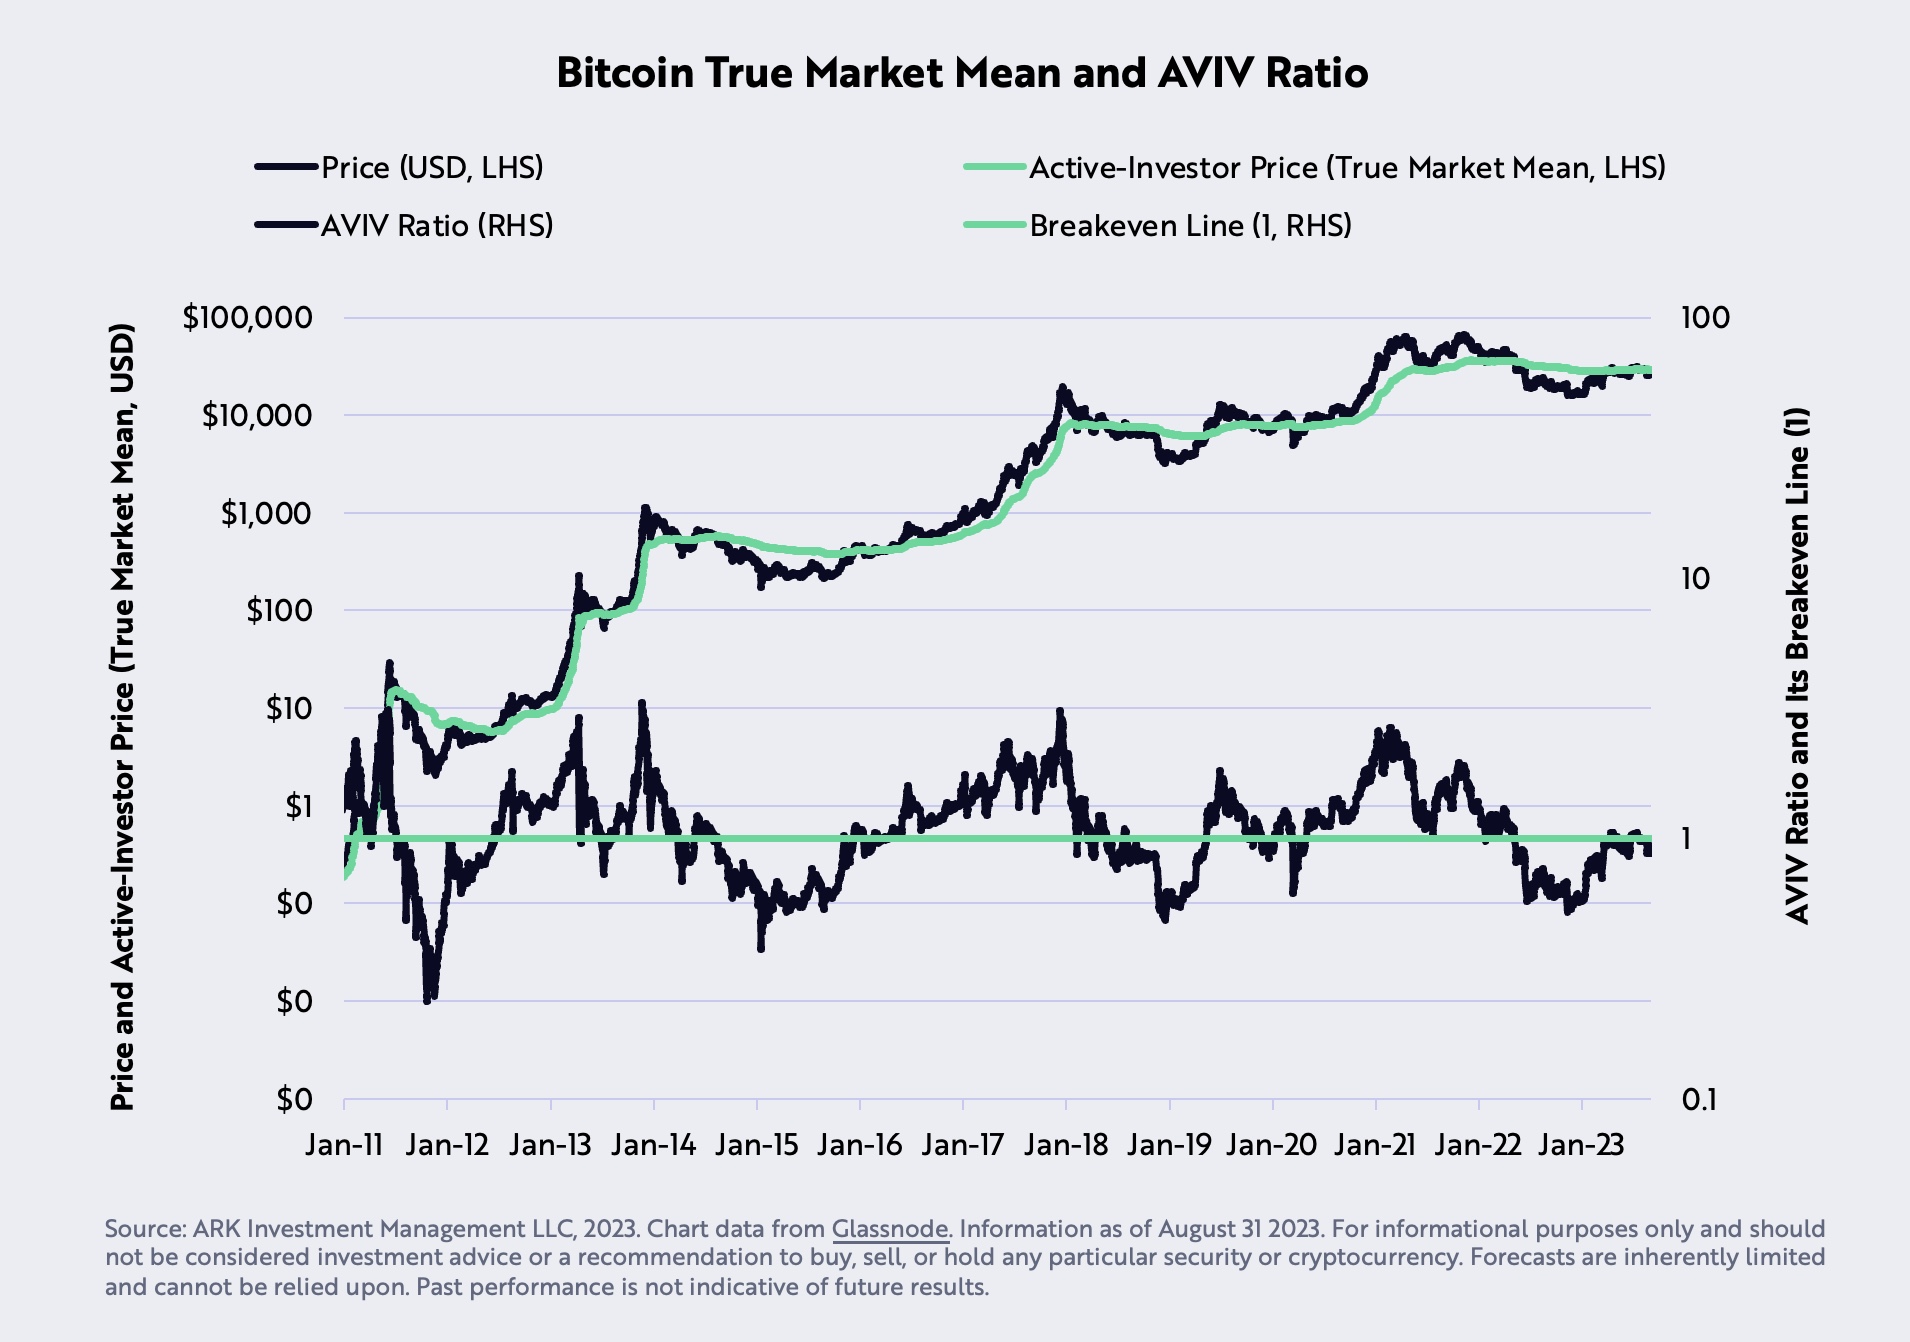
Bitcoin’s On-Chain Mean Resistance: The “on-chain mean,” also termed as the “active-investor price” or “true market mean,” reached $29,608 in August, establishing a potential significant resistance for BTC. This metric, a collaborative effort between ARK Invest and Glassnode, calculated by dividing investors’ cost basis by the number of active coins. These coins are determined based on the aggregate time they’ve remained dormant relative to the total supply.
Stablecoins Market Cap and Liquidity: Stablecoins, often viewed as a liquidity barometer for the market, have seen their 90-day supply drop over 20% from $162 billion in March 2022 to $120 billion currently, signaling a decline in onchain liquidity. However, net inflows during the same timeframe hint at a building bullish market momentum.
Bearish Arguments For BTC (All Macro)
Real GDP vs. Real GDI Growth Rates: A record divergence has been observed between the YoY percent changes in real Gross Domestic Product (GDP) and real Gross Domestic Income (GDI). Historically, GDP and GDI should be on par, as income earned should equate to the value of goods and services produced. Former Federal Reserve economist, Jeremy Nalewaik, has posited that GDI might be a more accurate indicator than GDP.
Real Federal Funds Policy Rate vs. Natural Rate of Interest: For the first time since 2009, the Real Federal Funds Policy Rate has surpassed the Natural Rate of Interest, indicating a shift towards restrictive monetary policy. This theoretical rate, as conceptualized by New York Federal Reserve President, John Williams, is the rate where the economy neither expands nor contracts. With monetary policy’s impact on the economy being long and variable, lending and borrowing are expected to face increased downward pressure.
Government’s Employment Revision: Employment, a lagging indicator, has been pivotal in the Federal Reserve’s rate decisions. Despite the labor disruptions caused by the COVID-19 pandemic expected to have been resolved by now, the government has revised nonfarm payroll statistics downward for six consecutive months. This suggests a weaker labor market than initially reported. The last instance of such a trend, outside of a recession, was in 2007, right before the Great Financial Crisis.
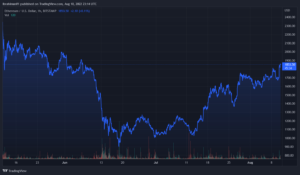
In summary, Ark Invest’s report presents three bullish, four neutral, and three bearish arguments on Bitcoin and the broader market, emphasizing that the market could be at a crucial turning point. At press time, BTC traded at $25,789.
Featured image from iStock, chart from TradingView.com
- SEO Powered Content & PR Distribution. Get Amplified Today.
- PlatoData.Network Vertical Generative Ai. Empower Yourself. Access Here.
- PlatoAiStream. Web3 Intelligence. Knowledge Amplified. Access Here.
- PlatoESG. Automotive / EVs, Carbon, CleanTech, Energy, Environment, Solar, Waste Management. Access Here.
- PlatoHealth. Biotech and Clinical Trials Intelligence. Access Here.
- ChartPrime. Elevate your Trading Game with ChartPrime. Access Here.
- BlockOffsets. Modernizing Environmental Offset Ownership. Access Here.
- Source: https://www.newsbtc.com/news/bitcoin/bitcoin-a-buy-or-sell-ark-invest-market-analysis/
- :has
- :is
- :where
- 000
- 1
- 15%
- 17
- 200-week moving average
- 2012
- 2021
- 2022
- 2023
- 29
- 300
- 8
- a
- accurate
- active
- aggregate
- All
- also
- an
- analysis
- and
- appeals
- Application
- ARE
- arguments
- Ark
- ark invest
- around
- AS
- At
- AUGUST
- average
- based
- basis
- battles
- BE
- bearish
- been
- before
- being
- below
- between
- Billion
- Bitcoin
- Bitcoin Futures
- Bitcoin Holders
- Bitcoin Monthly
- Bitcoin Price
- Borrowing
- both
- broader
- BTC
- BTCUSD
- Building
- bull
- Bull Market
- Bullish
- buy
- by
- calculated
- cap
- capital
- capitalization
- caused
- challenging
- Changes
- Chart
- Coins
- collaborative
- Collapse
- commission
- consecutive
- contracts
- Cost
- cost basis
- could
- Court
- COVID-19
- COVID-19 pandemic
- crisis
- crucial
- Current
- Currently
- day
- December
- december 2021
- decision
- decisions
- Decline
- deeper
- Despite
- determined
- Development
- Discount
- disruptions
- Divergence
- Domestic
- downside
- downward
- Drop
- during
- Earlier
- earned
- Economist
- economy
- effort
- emphasizing
- employment
- encompasses
- end
- establishing
- ETF
- exchange
- Exchange Commission
- Exiting
- expands
- expected
- Face
- Federal
- federal reserve
- Federal Reserve’s
- financial
- financial crisis
- Find
- findings
- First
- first time
- For
- Former
- four
- from
- FTX
- ftx collapse
- funds
- future
- Futures
- GBTC
- GDP
- General
- Glassnode
- goods
- Government
- Grayscale
- great
- gross
- Growth
- Have
- heightened
- High
- higher
- historically
- holders
- holistic
- However
- HTTPS
- image
- Impact
- improved
- in
- Income
- increased
- indicating
- Indicator
- inflows
- initially
- instance
- interest
- into
- Invest
- Investors
- ITS
- John
- jpg
- june
- labor
- labor market
- lagging
- landscape
- Last
- Legal
- lending
- likelihood
- Liquidation
- Liquidity
- Long
- Low
- Macro
- made
- March
- Market
- Market Analysis
- Market Cap
- Markets
- marking
- max-width
- mean
- measure
- metric
- might
- Miners
- Momentum
- Monetary
- Monetary Policy
- Month
- monthly
- months
- more
- moving
- moving average
- must
- Natural
- nav
- Neither
- net
- network
- Neutral
- New
- New York
- NewsBTC
- Nonfarm
- nor
- November
- now
- number
- observed
- of
- often
- on
- On-Chain
- Onchain
- open
- open interest
- Optimism
- or
- outflows
- outside
- over
- pandemic
- past
- Payroll
- percent
- perspectives
- pivotal
- plato
- Plato Data Intelligence
- PlatoData
- Point
- policy
- Post
- potential
- potentially
- presents
- president
- press
- pressure
- price
- primary
- Produced
- Product
- provided
- providing
- Q1
- rapid
- Rate
- Rates
- reached
- real
- realized
- realized price
- recession
- reconsider
- record
- recovery
- relative
- remained
- remains
- report
- Reported
- Reserve
- reserves
- Resistance
- resolved
- Restrictive
- right
- robust
- ruled
- s
- same
- saw
- SEC
- secondary
- Securities
- Securities and Exchange Commission
- seen
- sell
- sentiment
- serves
- Services
- setting
- settling
- Shares
- shift
- should
- significant
- since
- SIX
- Source
- Spot
- spot etf
- Stablecoins
- Stage
- statistics
- substantial
- such
- Suggests
- SUMMARY
- supply
- support
- surpassed
- than
- that
- The
- their
- theoretical
- These
- they
- this
- three
- time
- timeframe
- titled
- to
- Total
- towards
- traded
- TradingView
- transition
- Trend
- true
- Turning
- turning point
- u.s.
- U.S. Securities
- U.S. Securities and Exchange Commission
- U.S. Securities and Exchange Commission (SEC)
- us
- US Federal
- value
- variable
- View
- viewed
- vs
- was
- which
- Williams
- with
- witnessed
- york
- zephyrnet