
Published 1 hour ago
The U-shaped recovery in the Bitcoin price revealed the formation of a rounding bottom pattern. In theory, this bullish reversal pattern indicates a slow yet sustained recovery, which soars the assets price higher. Though the BTC price is currently struggling to surpass the local resistance of $17300, this bullish pattern may bolster buyers to achieve even higher price levels.
advertisement
Key points:
- A rounding bottom recovery in the current leading the ongoing recovery in the BTC price
- A bullish breakout from $17280 will trigger a 5% price jump
- The intraday trading volume in Bitcoin is $16.2 Billion, indicating a 1.5% loss
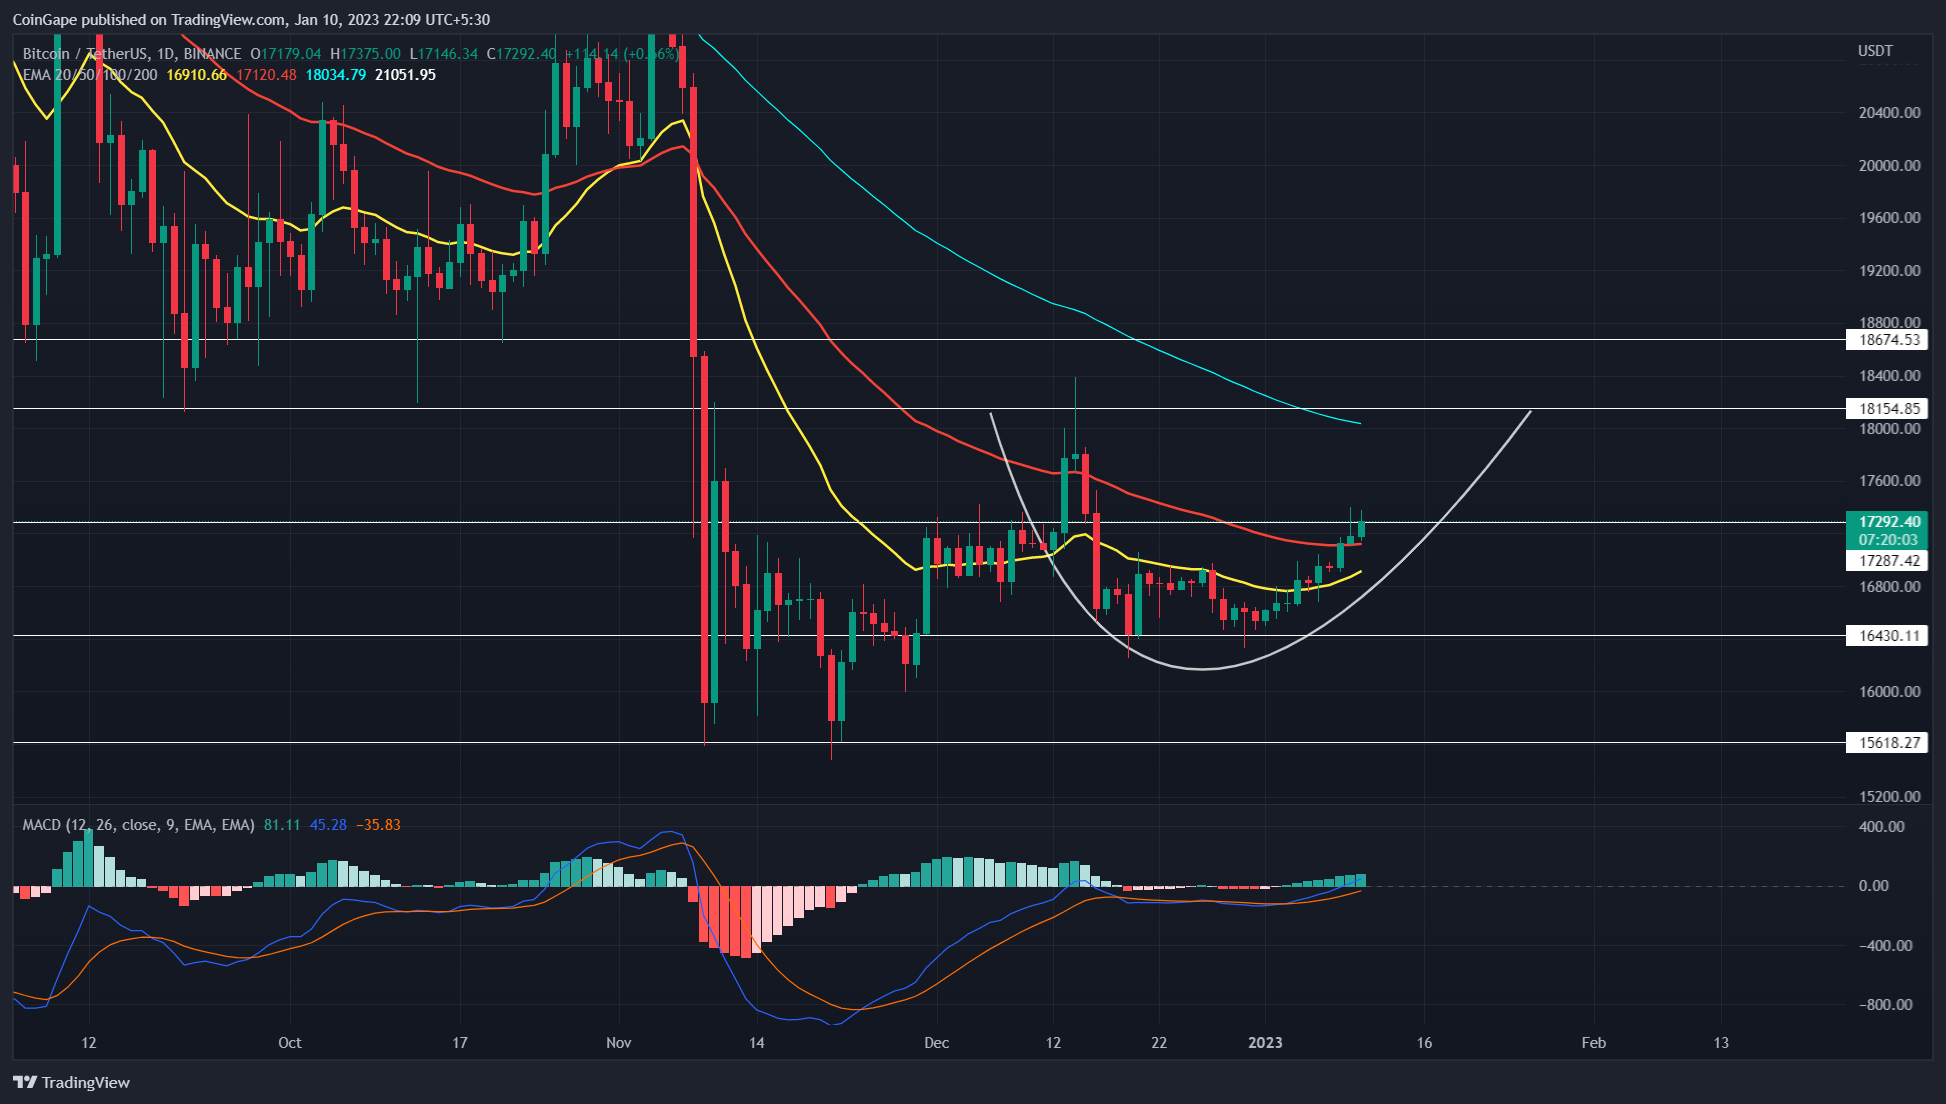
Source-Tradingview
During mid-December of 2022, the crypto market struggled through uncertainty, causing the Bitcoin price to hover above $16340 support. Though this narrow consolidation price created a stagnant market sentiment, the BTC price confirmed its sustainability above the $16340 support.
Thus, amid the new year recovery in the market, the coin price rebounded from the aforementioned support and triggered a new recovery rally. Over the last ten days, the Bitcoin price has surged 4.5% higher and reached its current price of $17233.
Trending Stories
Also Read: Top 10 DeFi Lending Platforms In 2023
During this bullish rally, the gradual rise in volume activity reflects the growth in buyers’ commitment to potential recovery. However, the Bitcoin price faces aggressive selling at the local resistance of $17300, putting the buyer’s goals under threat.
However, today the market will be closing watching Federal Reserve President Jerome Powell’s speech, as it could cause certain volatility in the market. If the above gives a positive push to the market, the BTC price may breach the $17300 barrier.
This bullish breakout will further bolster the rounding bottom formation and surge the prices 5% higher to hit the $18150 neckline resistance. A breakout from this resistance will be crucial for BTC holders as it triggers significant growth in the near term.
Technical indicator
EMAs: with the recent price jump, the BTC price breached the 20-and-50-day EMA, offering an additional support level for coin holders.
advertisement
MACD: The MACD and signal lines are on the verge of rising above the midline. This crossover will indicate the growing bullish momentum and a buy signal for interested traders.
Bitcoin Price Intraday Levels
- Spot rate: $17319
- Trend: Bullish
- Volatility: Medium
- Resistance levels- $18150 and $18700
- Support levels- $16430 and $16430
Share this article on:
The presented content may include the personal opinion of the author and is subject to market condition. Do your market research before investing in cryptocurrencies. The author or the publication does not hold any responsibility for your personal financial loss.
- SEO Powered Content & PR Distribution. Get Amplified Today.
- Platoblockchain. Web3 Metaverse Intelligence. Knowledge Amplified. Access Here.
- Source: https://coingape.com/markets/how-far-will-bitcoin-price-continue-its-ongoing-recovery-rally/
- 1
- 10
- 2022
- 7
- 9
- a
- above
- Achieve
- activity
- Additional
- aggressive
- Amid
- and
- article
- Assets
- author
- avatar
- barrier
- Beauty
- before
- Billion
- Bitcoin
- Bitcoin (BTC) Price
- Bitcoin Price
- blockchain
- bolster
- Bottom
- breach
- breakout
- Brian
- BTC
- btc price
- Bullish
- buy
- buyers
- Cause
- causing
- certain
- closing
- Coin
- Coingape
- COM
- commitment
- condition
- CONFIRMED
- consolidation
- content
- continue
- could
- created
- crucial
- crypto
- Crypto Market
- cryptocurrencies
- cryptocurrency
- Current
- Currently
- Days
- DeFi
- DeFi lending
- different
- EMA
- Entertainment
- Ether (ETH)
- Even
- faces
- Fashion
- Federal
- federal reserve
- finance
- financial
- follow
- formation
- from
- further
- gives
- Goals
- gradual
- Growing
- Growth
- higher
- Hit
- hold
- holders
- hover
- How
- However
- HTTPS
- in
- include
- Including
- indicate
- indicates
- interested
- investing
- IT
- journalism
- jump
- Last
- leading
- lending
- Level
- levels
- lines
- local
- loss
- Market
- market research
- market sentiment
- Momentum
- Near
- New
- new year
- offering
- ongoing
- Opinion
- past
- Pattern
- personal
- Platforms
- plato
- Plato Data Intelligence
- PlatoData
- points
- positive
- potential
- potential recovery
- Powell’s
- presented
- president
- price
- Prices
- Publication
- Push
- Putting
- rally
- Rate
- reached
- Read
- recent
- recovery
- reflects
- research
- Reserve
- Resistance
- responsibility
- Revealed
- Reversal
- Rise
- rising
- Selling
- sentiment
- Share
- Signal
- significant
- slow
- Soars
- speech
- Struggling
- subject
- support
- support level
- surge
- Surged
- surpass
- Sustainability
- ten
- The
- threat
- Through
- to
- today
- Topics
- Traders
- Trading
- trading volume
- TradingView
- trending
- trigger
- triggered
- Uncertainty
- under
- variety
- verge
- Volatility
- volume
- watching
- which
- will
- working
- written
- year
- years
- Your
- zephyrnet