On February 24th, the (Graph) GRT buyers arrested the downfall at $0.3 psychological level and rejected the price immediately. The altcoin surged 20% in the past four days, trying to breach the immediate resistance of $0.363. However, a genuine recovery needs the bulls to break and close above the $0.39 mark.
Key technical points:
- The GRT buyers breached a minor resistance level of $0.363
- The intraday trading volume in the GRT is $125.6 Million, indicating a 33.6% gain.
 Source- Tradingview
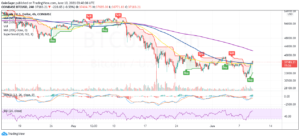
On February 21st, the GRT sellers gave a deceive breakdown from $3.9 support. The following retest day indicates the support has flipped to resistance, resulting in a 20% downfall. The sellers pulled the altcoin to a $0.3 psychological level, but a sudden demand in the crypto market reverted the price, accounting for a 15% rejection tail.
Today, the GRT/USDT pair bounced back from the $0.33 mark, registering a 9.2% intraday gain. The coin chart shows crucial SMAs(20, 50, 100, and 200) are declining in a bearish alignment, indicating a downtrend.
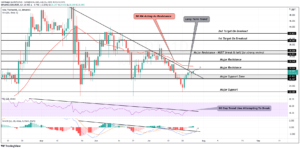
The sudden price pump pushed the MACD fast line higher, approaching the slow line from below. This bullish crossover would trigger a buy signal for the traders.
GRT/USDT: 4-Hour Time Frame Chart
 Source-Tradingview
Today’s GRT price jump would bolster the GRT buyers to breach the immediate resistance of $0.39. If they succeed, the traders would get their first sign of recovery and drive the altcoin 30% high to the $0.5 mark.
Contrary to the above assumption, if sellers mount stiff resistance at $0.39 and restrain the altcoin below. The selling pressure would accelerate and dump the price back to $0.33 support.
- Resistance levels- $0.39, $0.445
- Support levels are $0.33 and $0.3