- The recent three weeks of rally seen in spot Gold (XAU/USD) has been driven by geopolitical risk premium and positive momentum.
- The rise in the price actions of spot Gold has ignored the increase in the long-term opportunity cost of holding gold as the US 10-year Treasury yield rallied in tandem.
- Heightened stagflation risk is likely the cause of the ignorance of higher holding costs in Gold.
- The current short-term uptrend phase of spot Gold (XAU/USD) has reached an “overstretched condition” which increases the risk of a corrective retracement, watch the US$2,006 key short-term resistance.
This is a follow-up analysis of our prior report, “Gold Technical: A consolidation in the 10-year US Treasury yield may offer a relief bounce” published on 6 October 2023. Click here for a recap.
The price actions of spot Gold (XAU/USD) have risen by +10.3% right at the highlighted US$1,810 key support in the past three weeks and printed an intraday high of US$1,997 last Friday, 20 October 2023.
A medium-term uptrend phase may have kickstarted in Gold
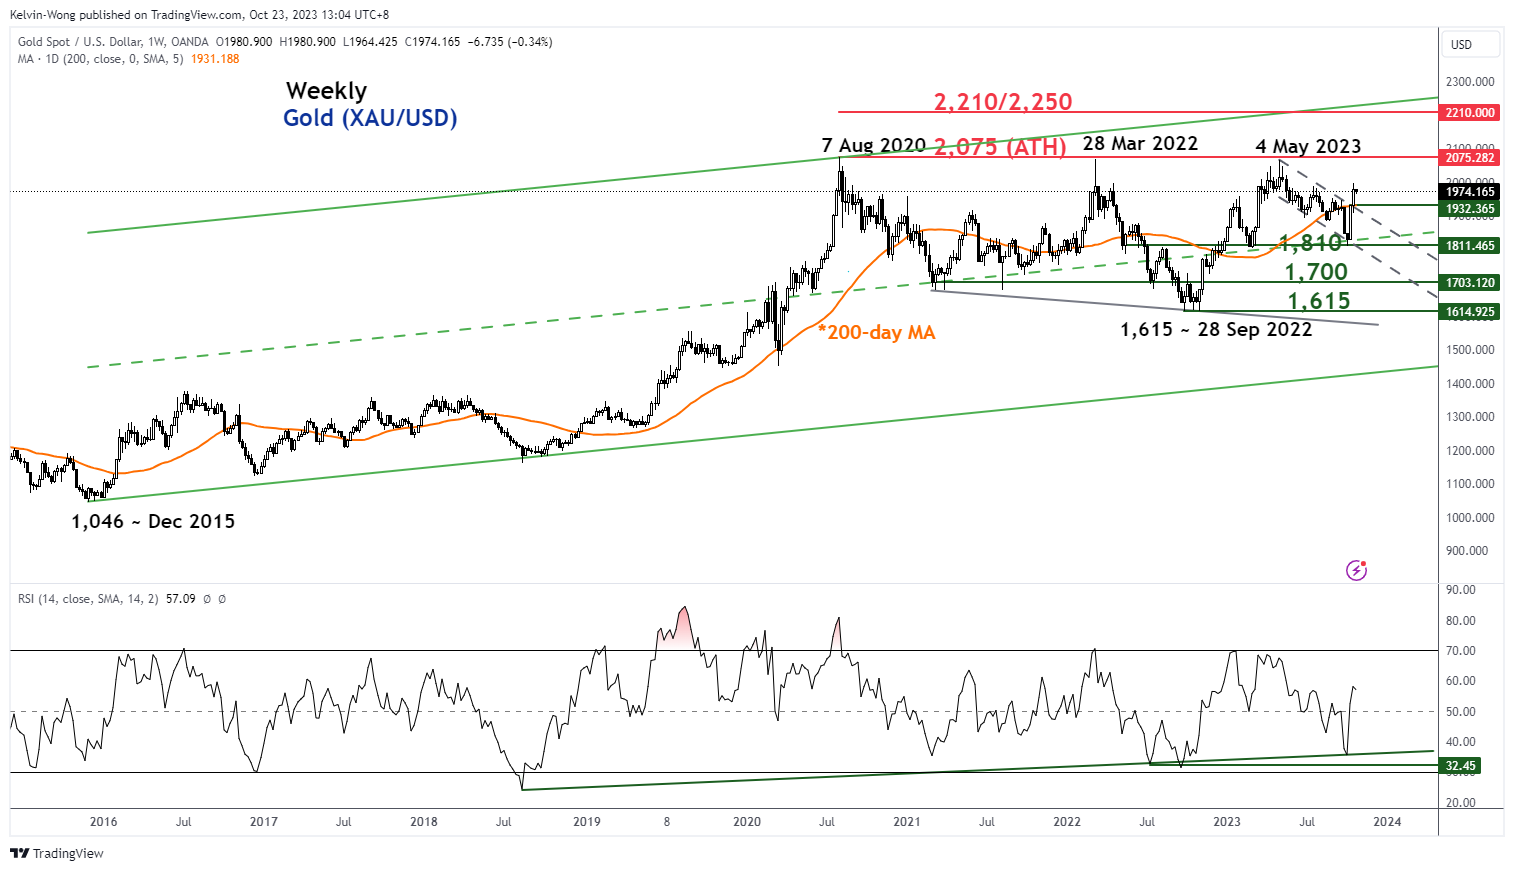
Fig 1: Spot Gold (XAU/USD) medium-term & major trends as of 23 Oct 2023 (Source: TradingView, click to enlarge chart)
One of the bullish primary drivers has been momentum where spot Gold (XAU/USD) surpassed two key technical milestones; the upper boundary of a medium-term descending channel that capped prior rallies since 4 May 2023 and the key 200-day moving average. The occurrences of these key resistance breakout episodes are likely to have led to a psychological positive feedback loop as well as short-covering activities because large non-commercial (speculators) net long positions in the Gold futures market had declined to 161,861 contracts for the week of 9 October 2023, a year-to-date low based on the Commitments of Traders report.
The other driver is the rising geopolitical risk premium due to the risk of a prolonged Israel-Hamas conflict as well as stagflation risk triggered by potential higher oil prices due to its spill-over impact to the wider Middle East region where supply disruption in oil may be weaponized for strategic reasons by key stakeholders such as Iran.
Interestingly, the heightened risk of stagflation seen in the last three weeks has overshadowed the increase in the opportunity cost of holding gold as the US 10-year Treasury yield also rallied in unison and hit an intraday high of 5% last Thursday 19 October, its highest level since July 2007 before the onset of the Great Financial Crisis.
A minor corrective retracement/pull-back looms for Gold
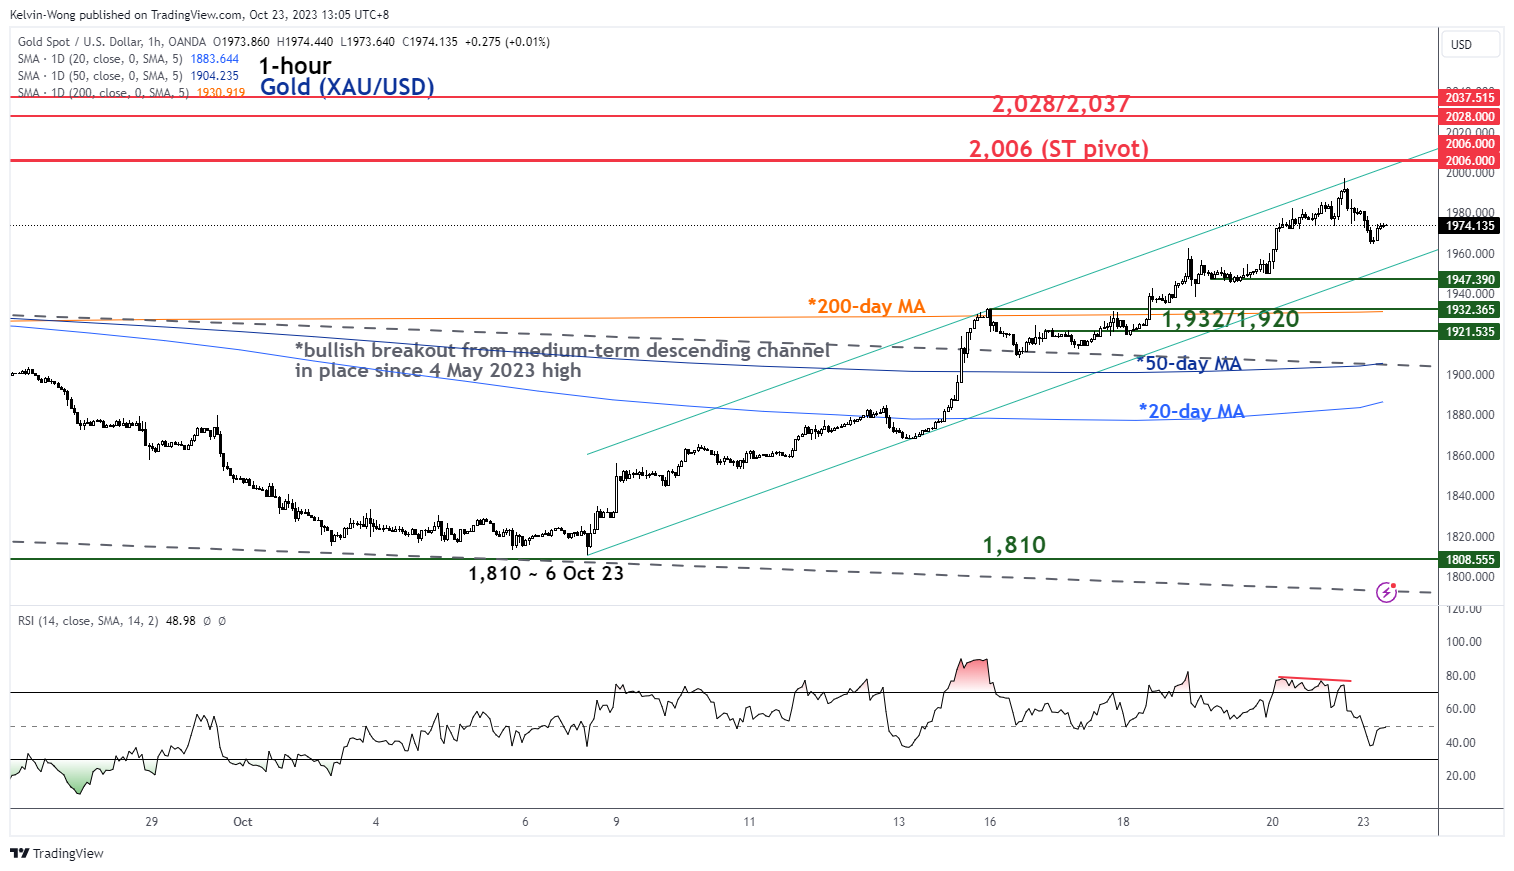
Fig 2: Spot Gold (XAU/USD) minor short-term trend as of 23 Oct 2023 (Source: TradingView, click to enlarge chart)
Right now, technically speaking, the short-term uptrend phase of Gold (XAU/USD) in place since the 6 October 2023 low of US$1,810 has reached an “overstretched condition” after it scaled to a five-month high seen last Friday, 20 October.
Price actions of Gold (XAU/USD) have reacted negatively at the upper boundary of the short-term ascending channel that is right below a key short-term pivotal resistance of US$2,006 (the former congestion area of 5 May/12 May 2023 and a Fibonacci extension projection cluster) coupled with a bearish divergence condition seen in the hourly RSI momentum indicator at its overbought region (above 70 level) on last Friday.
These observations suggest the bullish momentum of the short-term uptrend phase in Gold (XAU/USD) has abated and the next potential movement may be a corrective retracement before a new potential impulsive up move sequence unfolds due to the clearance of the key 200-day moving average and the former medium-term descending channel resistance at around US$1,900.
A break below the near-term support of US$1,947 reinforces the retracement scenario towards the immediate support zone of US$1,932/1,920 (200-day moving average and the 38.2% Fibonacci retracement of the recent rally from 6 October 2023 low to 20 October 2023 high).
On the flip side, a clearance above US$2,006 negates the short-term bearish tone for a continuation of the bullish impulsive up move sequence towards the next intermediate resistance at US$2,028/2,037 (11 May 2023 minor swing high and a Fibonacci extension projection) in the first step.
Content is for general information purposes only. It is not investment advice or a solution to buy or sell securities. Opinions are the authors; not necessarily that of OANDA Business Information & Services, Inc. or any of its affiliates, subsidiaries, officers or directors. If you would like to reproduce or redistribute any of the content found on MarketPulse, an award winning forex, commodities and global indices analysis and news site service produced by OANDA Business Information & Services, Inc., please access the RSS feed or contact us at info@marketpulse.com. Visit https://www.marketpulse.com/ to find out more about the beat of the global markets. © 2023 OANDA Business Information & Services Inc.
Latest posts by Kelvin Wong (see all)
- SEO Powered Content & PR Distribution. Get Amplified Today.
- PlatoData.Network Vertical Generative Ai. Empower Yourself. Access Here.
- PlatoAiStream. Web3 Intelligence. Knowledge Amplified. Access Here.
- PlatoESG. Carbon, CleanTech, Energy, Environment, Solar, Waste Management. Access Here.
- PlatoHealth. Biotech and Clinical Trials Intelligence. Access Here.
- Source: https://www.marketpulse.com/commodities/gold-technical-at-the-risk-of-a-minor-pull-back-before-potential-new-upleg/kwong
- :has
- :is
- :not
- :where
- $UP
- 1
- 11
- 15 years
- 15%
- 19
- 2%
- 20
- 2023
- 23
- 70
- 700
- 9
- a
- abated
- About
- above
- access
- actions
- activities
- addition
- advice
- affiliates
- After
- also
- an
- analyses
- analysis
- and
- any
- ARE
- AREA
- around
- AS
- At
- author
- authors
- avatar
- average
- award
- based
- BE
- bearish
- bearish divergence
- beat
- because
- been
- before
- below
- Box
- Break
- breakout
- Bullish
- business
- buttons
- buy
- by
- Cause
- Channel
- Chart
- clearance
- click
- Cluster
- COM
- combination
- commitments
- Commodities
- condition
- conducted
- conflict
- congestion
- Connecting
- consolidation
- contact
- content
- continuation
- contracts
- Cost
- Costs
- coupled
- courses
- crisis
- Current
- Directors
- Disruption
- Divergence
- driven
- driver
- drivers
- due
- East
- Elliott
- enlarge
- Episodes
- Ether (ETH)
- exchange
- experience
- expert
- extension
- feedback
- Fibonacci
- financial
- financial crisis
- Find
- First
- Flip
- flow
- For
- foreign
- foreign exchange
- forex
- Former
- found
- Friday
- from
- fund
- fundamental
- Futures
- General
- geopolitical
- Global
- global markets
- Gold
- great
- had
- Have
- heightened
- High
- higher
- highest
- Highlighted
- Hit
- holding
- HTTPS
- if
- Ignorance
- immediate
- Impact
- impulsive
- in
- Inc.
- Increase
- Increases
- Indicator
- Indices
- information
- Intermediate
- investment
- Iran
- IT
- ITS
- July
- Kelvin
- Key
- key resistance
- kickstarted
- large
- Last
- Led
- Level
- levels
- like
- likely
- Long
- long-term
- Low
- Macro
- major
- Market
- market outlook
- market research
- MarketPulse
- Markets
- max-width
- May..
- Middle
- Middle East
- Milestones
- minor
- Momentum
- more
- move
- movement
- moving
- moving average
- necessarily
- negatively
- net
- New
- news
- next
- non-commercial
- now
- numerous
- observations
- Oct
- october
- of
- offer
- officers
- Oil
- on
- only
- Opinions
- Opportunity
- or
- Other
- our
- out
- Outlook
- over
- passionate
- past
- perspectives
- phase
- photo
- pivotal
- Place
- plato
- Plato Data Intelligence
- PlatoData
- please
- positioning
- positions
- positive
- Posts
- potential
- Premium
- price
- Prices
- primary
- Prior
- Produced
- Projection
- providing
- psychological
- purposes
- rallies
- rally
- reached
- reasons
- recap
- recent
- region
- reinforces
- relief
- report
- research
- Resistance
- retail
- retracement
- Reversal
- right
- Rise
- Risen
- rising
- Risk
- rsi
- rss
- scenario
- Securities
- seen
- sell
- senior
- Sequence
- service
- Services
- sharing
- short-term
- side
- since
- Singapore
- site
- solution
- Source
- speaking
- specializing
- Spot
- stagflation
- stakeholders
- Step
- stock
- Stock markets
- Strategic
- Strategist
- subsidiaries
- such
- suggest
- supply
- support
- surpassed
- Swing
- Tandem
- Technical
- Technical Analysis
- technically
- ten
- that
- The
- These
- thousands
- three
- thursday
- to
- TONE
- towards
- Traders
- Trading
- TradingView
- Training
- treasury
- Trend
- Trends
- triggered
- two
- unique
- unison
- uptrend
- us
- US Treasury
- using
- v1
- Visit
- Watch
- Wave
- week
- Weeks
- WELL
- which
- wider
- winning
- with
- wong
- would
- XAU/USD
- years
- Yield
- you
- zephyrnet