- Gold price fails to preserve intraday gains to a multi-month top amid a modest USD recovery.
- A positive risk tone further contributes to capping the upside for the safe-haven precious metal.
- Fed rate cut bets drag the US bond yields lower, which should cap the USD and lend support.
Gold price (XAU/USD) struggles to capitalize on its intraday gains to the $2,052 area and retreats from a near seven-month top touched earlier this Wednesday. A modest US Dollar (USD) bounces off its lowest level since August 11, along with a generally positive risk tone, turns out to be a key factor acting as a headwind for the safe-haven precious metal. The commodity, however, manages to hold in positive territory for the fifth straight day – also the sixth day in the previous seven – and seems poised to appreciate further in the wake of expectations that the Federal Reserve (Fed) is done raising interest rates.
The recent less hawkish remarks by several Fed officials reaffirmed market bets that the US central bank may begin easing its monetary policy as early as March 2024. Apart from this, the underwhelming US bond auction on Tuesday drags the yield on the benchmark 10-year US government bond to its lowest level since September. This might hold back the USD bulls from placing aggressive bets and should continue to act as a tailwind for the non-yielding Gold price. Traders might also refrain from placing aggressive bets ahead of the prelim US GDP report, due for release later during the North American session.
The broader market consensus is that the world’s largest economy probably expanded by a 5% annualized pace during the third quarter as against the 4.9% growth reported previously. This, along with Fedspeaks and the US bond yields, will drive the USD demand and produce short-term trading opportunities around the Gold price. The focus, however, remains glued to the crucial US Core PCE Price Index data on Thursday, which will play a key role in influencing expectations about the Fed’s next policy move. This, in turn, will provide a fresh directional impetus to the Greenback and the precious metal.
Daily Digest Market Movers: Gold price bulls turn cautious near multi-month top amid a modest USD recovery
- The US Dollar rebounds from over a three-and-half-month low and acts as a headwind for the Gold price, though bets for rate cuts by the Federal Reserve in 2024 continue to lend support.
- Fed Governor Christopher Waller said on Tuesday that he could see a point where the central bank might start lowering rates if inflation continues to ease over the next few months.
- Waller added that he is increasingly confident that policy is currently well-positioned to slow the economy and get inflation back to the central bank’s 2% target.
- Fed Governor Michelle Bowman offered a contrasting view and reiterated her belief that more rate hikes likely will be needed as evolving dynamics keep inflation elevated.
- Markets expect the Fed to hold its key lending rate steady in a target range between 5.25%-5.5% in December, though officials have stressed the need to remain vigilant on inflation and keep their options open.
- The Israel-Hamas ceasefire deal has been extended by two days beyond its original expiration on Tuesday morning, which could dim the metal’s safe-haven appeal.
- Hamas released about 50 hostages as part of the original agreement and is expected to free another 20 over the next two days in exchange for the release of Palestinian prisoners by Israel.
- Traders now look to the prelim US GDP report, which is expected to show that the world’s largest economy expanded by a 5% annualized pace during the third quarter as against the 4.9% estimated.
- The market attention will then shift to the US Core PCE Price Index – the Fed’s preferred benchmark for measuring longer-term inflation trends on Thursday.
Technical Analysis: Gold price might continue to attract some dip-buying at lower levels
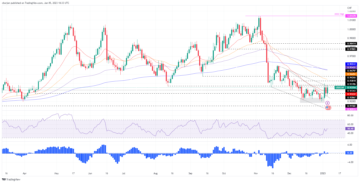
From a technical perspective, this week’s sustained breakout through the $2,008-2,010 barrier and the subsequent move-up support prospects for a further appreciating move. That said, the Relative Strength Index (RSI) on the daily chart is flashing slightly overbought conditions and warrants some caution for bullish traders. Hence, it will be prudent to wait for some near-term consolidation or a modest pullback before positioning for additional gains.
Any corrective pullback below the Asian session low, however, is likely to find decent support and attract fresh buyers near the $2,035-2,034 region. This should help limit the downside for the Gold price near the $2,020 level, which should now act as a key pivotal point. On the flip side, some follow-through buying beyond the $2,052 region, or a multi-month top touched earlier this Wednesday, will set the stage for a move towards challenging the all-time high, around the $2,079-2,080 zone set in May.
US Dollar price this month
The table below shows the percentage change of US Dollar (USD) against listed major currencies this month. US Dollar was the weakest against the New Zealand Dollar.
| USD | EUR | GBP | CAD | AUD | JPY | NZD | CHF | |
| USD | -3.99% | -4.61% | -2.44% | -4.95% | -2.76% | -6.60% | -3.76% | |
| EUR | 3.83% | -0.60% | 1.51% | -0.94% | 1.18% | -2.53% | 0.22% | |
| GBP | 4.43% | 0.61% | 2.11% | -0.32% | 1.77% | -1.90% | 0.84% | |
| CAD | 2.37% | -1.52% | -2.14% | -2.47% | -0.32% | -4.07% | -1.29% | |
| AUD | 4.73% | 0.92% | 0.34% | 2.39% | 2.08% | -1.57% | 1.15% | |
| JPY | 2.68% | -1.19% | -1.79% | 0.33% | -2.13% | -3.75% | -0.93% | |
| NZD | 6.19% | 2.46% | 1.87% | 3.92% | 1.54% | 3.60% | 2.70% | |
| CHF | 3.63% | -0.22% | -0.81% | 1.27% | -1.16% | 0.93% | -2.74% |
The heat map shows percentage changes of major currencies against each other. The base currency is picked from the left column, while the quote currency is picked from the top row. For example, if you pick the Euro from the left column and move along the horizontal line to the Japanese Yen, the percentage change displayed in the box will represent EUR (base)/JPY (quote).
Fed FAQs
Monetary policy in the US is shaped by the Federal Reserve (Fed). The Fed has two mandates: to achieve price stability and foster full employment. Its primary tool to achieve these goals is by adjusting interest rates.
When prices are rising too quickly and inflation is above the Fed’s 2% target, it raises interest rates, increasing borrowing costs throughout the economy. This results in a stronger US Dollar (USD) as it makes the US a more attractive place for international investors to park their money.
When inflation falls below 2% or the Unemployment Rate is too high, the Fed may lower interest rates to encourage borrowing, which weighs on the Greenback.
The Federal Reserve (Fed) holds eight policy meetings a year, where the Federal Open Market Committee (FOMC) assesses economic conditions and makes monetary policy decisions.
The FOMC is attended by twelve Fed officials – the seven members of the Board of Governors, the president of the Federal Reserve Bank of New York, and four of the remaining eleven regional Reserve Bank presidents, who serve one-year terms on a rotating basis.
In extreme situations, the Federal Reserve may resort to a policy named Quantitative Easing (QE). QE is the process by which the Fed substantially increases the flow of credit in a stuck financial system.
It is a non-standard policy measure used during crises or when inflation is extremely low. It was the Fed’s weapon of choice during the Great Financial Crisis in 2008. It involves the Fed printing more Dollars and using them to buy high grade bonds from financial institutions. QE usually weakens the US Dollar.
Quantitative tightening (QT) is the reverse process of QE, whereby the Federal Reserve stops buying bonds from financial institutions and does not reinvest the principal from the bonds it holds maturing, to purchase new bonds. It is usually positive for the value of the US Dollar.
- SEO Powered Content & PR Distribution. Get Amplified Today.
- PlatoData.Network Vertical Generative Ai. Empower Yourself. Access Here.
- PlatoAiStream. Web3 Intelligence. Knowledge Amplified. Access Here.
- PlatoESG. Carbon, CleanTech, Energy, Environment, Solar, Waste Management. Access Here.
- PlatoHealth. Biotech and Clinical Trials Intelligence. Access Here.
- Source: https://www.fxstreet.com/news/gold-price-advances-to-multi-month-top-as-fed-rate-cut-bets-continue-to-weigh-on-usd-202311290420
- :has
- :is
- :not
- :where
- 1
- 11
- 2%
- 20
- 2008
- 2024
- 31
- 40
- 41
- 50
- a
- About
- above
- Achieve
- Act
- acting
- acts
- added
- Additional
- additional gains
- adjusting
- against
- aggressive
- Agreement
- ahead
- along
- also
- American
- Amid
- analysis
- and
- Animate
- annualized
- Another
- apart
- appeal
- appreciate
- appreciating
- ARE
- AREA
- around
- AS
- asian
- assesses
- At
- attention
- attract
- attractive
- Auction
- AUGUST
- back
- Bank
- barrier
- base
- basis
- BE
- been
- before
- begin
- belief
- below
- Benchmark
- Bets
- between
- Beyond
- board
- bond
- Bond yields
- Bonds
- Borrowing
- Box
- breakout
- broader
- Bullish
- Bulls
- buy
- buyers
- Buying
- by
- cap
- capitalize
- caution
- cautious
- central
- Central Bank
- challenging
- change
- Changes
- Chart
- choice
- Christopher
- Christopher Waller
- Column
- committee
- commodity
- conditions
- confident
- Consensus
- consolidation
- content
- continue
- continues
- contributes
- Core
- Costs
- could
- credit
- crises
- crisis
- crucial
- currencies
- Currency
- Currently
- Cut
- cuts
- daily
- data
- day
- Days
- deal
- December
- decent
- decisions
- Demand
- Digest
- displayed
- does
- Dollar
- dollars
- done
- downside
- drive
- due
- during
- dynamics
- each
- Earlier
- Early
- ease
- easing
- Economic
- Economic Conditions
- economy
- elevated
- eleven
- employment
- encourage
- ends
- estimated
- EUR
- Euro
- evolving
- example
- exchange
- expanded
- expect
- expectations
- expected
- expiration
- extreme
- extremely
- factor
- fails
- Falls
- FAQ
- Fed
- Federal
- Federal Open Market Committee
- federal reserve
- Federal Reserve Bank
- Federal Reserve Bank of New York
- few
- fifth
- financial
- financial crisis
- Financial institutions
- financial system
- Find
- flashing
- Flip
- flow
- Focus
- FOMC
- For
- Foster
- four
- Free
- fresh
- from
- full
- further
- Gains
- GDP
- generally
- get
- Goals
- Gold
- gold price
- Government
- Governor
- governors
- grade
- great
- Greenback
- Growth
- Have
- Hawkish
- he
- help
- hence
- her
- High
- Hikes
- hold
- holds
- Horizontal
- hostages
- However
- HTTPS
- if
- in
- Increases
- increasing
- increasingly
- index
- inflation
- influencing
- institutions
- interest
- Interest Rates
- International
- international investors
- Investors
- involves
- Israel
- IT
- ITS
- Japanese
- Japanese Yen
- jpg
- Keep
- Key
- key factor
- largest
- later
- left
- LEND
- lending
- less
- Level
- likely
- LIMIT
- Line
- Listed
- Look
- Low
- lower
- lowering
- lowest
- lowest level
- major
- MAKES
- manages
- mandates
- map
- March
- March 2024
- Market
- May..
- measure
- measuring
- meetings
- Members
- metal
- michelle
- might
- modest
- module
- Monetary
- Monetary Policy
- money
- Month
- months
- more
- morning
- move
- Movers
- Named
- Near
- Need
- needed
- New
- New York
- New Zealand
- next
- North
- now
- of
- off
- offered
- officials
- on
- open
- opportunities
- Options
- or
- original
- Other
- out
- over
- Pace
- Park
- part
- pce
- Peak
- percentage
- perspective
- pick
- picked
- pivotal
- Place
- placing
- plato
- Plato Data Intelligence
- PlatoData
- Play
- Point
- poised
- policy
- positioning
- positive
- Precious
- preferred
- president
- Presidents
- previous
- previously
- price
- Prices
- primary
- Principal
- printing
- prisoners
- probably
- process
- produce
- prospects
- provide
- pullback
- purchase
- QE
- QT
- quantitative
- Quantitative Easing
- Quarter
- quickly
- quote
- raises
- raising
- range
- Rate
- rate hikes
- Rates
- reaffirmed
- recent
- recovery
- region
- regional
- reinvest
- relative
- relative strength index
- Relative Strength Index (RSI)
- release
- released
- remain
- remaining
- remains
- report
- Reported
- represent
- Reserve
- reserve bank
- Resort
- Results
- reverse
- rising
- Risk
- Role
- ROW
- rsi
- s
- Said
- see
- seems
- September
- serve
- session
- set
- seven
- several
- shaped
- shift
- short-term
- should
- show
- Shows
- side
- since
- situations
- sixth
- slow
- some
- Stability
- Stage
- stages
- start
- starts
- steady
- Stops
- straight
- strength
- stronger
- Struggles
- subsequent
- substantially
- support
- sustained
- system
- table
- Tailwind
- Target
- Technical
- terms
- territory
- that
- The
- the Fed
- the world
- their
- Them
- then
- These
- Third
- this
- this week
- though?
- Through
- throughout
- thursday
- tightening
- to
- TONE
- too
- tool
- top
- touched
- towards
- Traders
- Trading
- Trends
- Tuesday
- TURN
- turns
- two
- unemployment
- unemployment rate
- Upside
- us
- US bond yields
- US Central Bank
- US Core PCE
- US Core PCE Price Index
- US Dollar
- US GDP
- us government
- USD
- used
- using
- usually
- value
- View
- wait
- Wake
- Warrants
- was
- Wednesday
- week
- weighs
- when
- which
- while
- WHO
- will
- with
- world
- XAU/USD
- year
- Yen
- Yield
- yields
- york
- you
- Zealand
- zephyrnet