- Data revealed that British retail sales grew less than anticipated in August.
- August marked the sixth instance in 2023 where UK sales volumes grew month-to-month.
- UK’s consumer confidence reached its highest level since January last year.
Today’s GBP/USD price analysis remains bearish as the pound weakened against the dollar on downbeat UK sales data.
-If you are interested in social trading apps, check our detailed guide-
Official figures indicated that British retail sales increased by 0.4% compared to a rain-affected July. This result fell short of the 0.5% rise predicted by economists surveyed by Reuters. British retail sales recovered in August after a damp July. Consequently, it reinforced the notion that consumers in the country were managing the challenges of rising living costs.
Moreover, the Office for National Statistics reported a 0.4% month-on-month growth in sales volumes for August.
Britain’s inflation rate stood at 6.7% the previous month, a decrease from its peak of over 11% in October of the prior year. However, it is still the highest among the world’s major developed economies. Notably, August marked the sixth instance in 2023, where sales volumes grew month-to-month, indicating resilience in consumer demand.
Additionally, market research firm GfK reported earlier on Friday that its measure of consumer confidence reached its highest level since January of the previous year. However, it is worth considering that the impact of higher UK rates since December 2021 may not have fully materialized yet. It could potentially dampen consumer spending later in 2023. On Thursday, the Bank of England paused its series of interest rate hikes, citing signs of an economic slowdown.
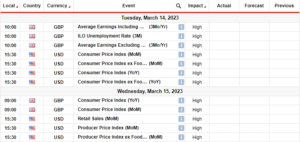
GBP/USD key events today
Investors do not expect data from the UK. However, the US will release one crucial report.
- The S&P Global Services PMI for September.
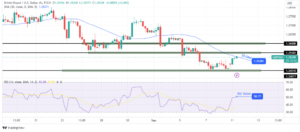
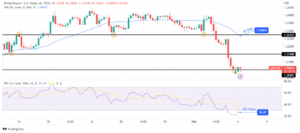
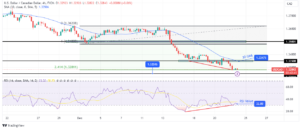
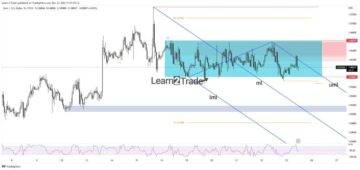
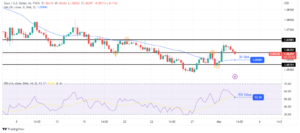
GBP/USD technical price analysis: Bears set sights on 1.2200 support.

On the charts, the GBP/USD pair has broken below the 1.2302 support level. Moreover, it pulled back to retest the level and continued to lower. The bias is bearish as the price is in a developed downtrend. It has respected the 30-SMA as resistance multiple times and consistently made lower lows.
-If you are interested in brokers with Nasdaq, check our detailed guide-
Moreover, the RSI is on the verge of dipping into the oversold region, indicating solid bearish momentum. At the moment, bears are eyeing the 1.2200 support level, and the price will likely soon reach this level.
Looking to trade forex now? Invest at eToro!
67% of retail investor accounts lose money when trading CFDs with this provider. You should consider whether you can afford to take the high risk of losing your money.
- SEO Powered Content & PR Distribution. Get Amplified Today.
- PlatoData.Network Vertical Generative Ai. Empower Yourself. Access Here.
- PlatoAiStream. Web3 Intelligence. Knowledge Amplified. Access Here.
- PlatoESG. Carbon, CleanTech, Energy, Environment, Solar, Waste Management. Access Here.
- PlatoHealth. Biotech and Clinical Trials Intelligence. Access Here.
- Source: https://www.forexcrunch.com/gbp-usd-price-analysis-pound-slides-on-dismal-sales-data/
- :has
- :is
- :not
- :where
- ][p
- 1
- 2021
- 2023
- a
- Accounts
- After
- against
- among
- an
- analysis
- and
- Anticipated
- ARE
- AS
- At
- AUGUST
- back
- Bank
- Bank of England
- bearish
- Bearish Momentum
- Bears
- below
- bias
- British
- Broken
- by
- CAN
- CFDs
- challenges
- Charts
- check
- compared
- confidence
- Consequently
- Consider
- considering
- consistently
- consumer
- Consumers
- continued
- Costs
- could
- country
- crucial
- data
- December
- december 2021
- decrease
- Demand
- detailed
- developed
- do
- Dollar
- Earlier
- Economic
- economies
- economists
- England
- events
- expect
- Figures
- Firm
- For
- forex
- Friday
- from
- fully
- GBP/USD
- Global
- grew
- Growth
- Have
- High
- higher
- highest
- Hikes
- However
- HTTPS
- Impact
- in
- increased
- indicated
- indicating
- inflation
- inflation rate
- instance
- interest
- INTEREST RATE
- INTEREST RATE HIKES
- interested
- into
- Invest
- investor
- IT
- ITS
- January
- July
- Key
- Last
- Last Year
- later
- less
- Level
- likely
- living
- lose
- losing
- lower
- Lows
- made
- major
- managing
- marked
- Market
- market research
- max-width
- May..
- measure
- moment
- Momentum
- money
- Month
- Moreover
- multiple
- National
- notably
- Notion
- now
- october
- of
- Office
- on
- ONE
- our
- over
- pair
- Peak
- plato
- Plato Data Intelligence
- PlatoData
- pmi
- potentially
- pound
- Pound Slides
- predicted
- previous
- price
- Price Analysis
- Prior
- provider
- Rate
- rate hikes
- Rates
- reach
- reached
- region
- release
- remains
- report
- Reported
- research
- resilience
- Resistance
- respected
- result
- retail
- Retail Sales
- Reuters
- Revealed
- Rise
- rising
- Risk
- rsi
- S&P
- S&P Global
- sales
- September
- Series
- Services
- set
- Short
- should
- Sights
- Signs
- since
- sixth
- Slides
- Slowdown
- solid
- Soon
- Spending
- statistics
- Still
- support
- support level
- surveyed
- Take
- Technical
- than
- that
- The
- the UK
- this
- thursday
- times
- to
- trade
- Trading
- Uk
- us
- verge
- volumes
- were
- when
- whether
- will
- with
- world’s
- worth
- Yahoo
- year
- yet
- you
- Your
- zephyrnet