- GBP/USD holds to decent gains around 1.2070s but below the 200-day EMA.
- US Chicago Manufacturing PMI exceeded estimates but remains at contractionary territory.
- GBP/USD Price Analysis: Upward biased, but needs to clear the 200-DMA to extend its gains.
The Pound Sterling (GBP) pares its losses against the US Dollar (USD) due to risk aversion dominating the last trading day of 2022. Wall Street extended its losses, while the lack of news kept the GBP/USD within familiar exchange rates. At the time of writing, the GBP/USD is trading at 1.2079 after testing daily lows of 1.2009.
US equities continued to fall amidst the lack of news. The Chicago Purchasing Manufacturing Index (PMI) for December exceeded estimates of 40.5, at 44.9 but remained in contractionary territory. According to sources cited by MarketWatch, the manufacturing sector is suffering from slow demand spurred by a weaker global economy and a backlog of unfilled orders from the pandemic.
In the meantime, the lack of economic data in the UK economic calendar keeps investors adrift to the latest developments linked to the energy crisis in the UK. According to the Times, UK’s finance minister Jeremy Hunt has been weighing how much assistance to provide companies when an existing six-month energy support program worth £18 billion expires in March of 2023.
Meanwhile, the US Dollar Index, a gauge of the buck’s value against a basket of six rivals, extended its losses to 0.40%, at 103.560, contrarily to US Treasury bond yields, and a tailwind for the GBP/USD. The US 10-year benchmark note rate is gaining seven and a half bps at 3.894%.
Ahead into the next week, the UK economic calendar will feature the S&P Global/CIPS Manufacturing PMI on Tuesday. On the US front, the docket will feature the S&P Global Manufacturing PMI.
GBP/USD Price Analysis: Technical outlook
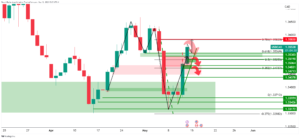
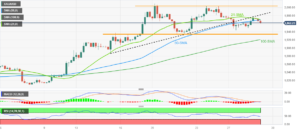
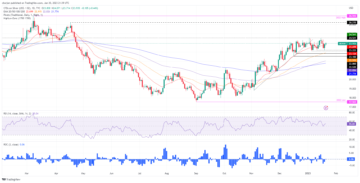
the daily chart depicts the GBP/USD consolidated ahead into the following year. The 200-day Exponential Moving Average (EMA) at 1.2111 is proving difficult resistance to hurdle, while GBP/USD buyers are defending the 1.2000 figure. The Relative Strength Index (RSI) aims higher after crossing the 50 midline, while the Rate of Change (RoC) displays selling pressure waning.
Hence, the GBP/USD is neutral-upward biased, and its first resistance is the 200-day EMA at 1.2111. Break above will expose the December 19 daily high of 1.2242, followed by the 1.2300 figure. As an alternate scenario, the 1.2000 figure is the first defense line for GBP buyers. Once cleared, the next support would be the 50-day EMA at 1.1942, followed by 1.1900.

- SEO Powered Content & PR Distribution. Get Amplified Today.
- Platoblockchain. Web3 Metaverse Intelligence. Knowledge Amplified. Access Here.
- Source: https://www.fxstreet.com/news/gbp-usd-advances-steadily-towards-12080s-on-a-weak-usd-202212301733
- 1
- 2022
- 9
- a
- above
- According
- advances
- After
- against
- ahead
- aims
- amidst
- analysis
- and
- around
- Assistance
- average
- basket
- below
- Benchmark
- Billion
- bond
- Bond yields
- Break
- buyers
- Calendar
- change
- Chart
- chicago
- clear
- Companies
- continued
- crisis
- daily
- data
- day
- December
- Defending
- Defense
- Demand
- developments
- difficult
- displays
- Dollar
- dollar index
- Economic
- economy
- EMA
- energy
- energy crisis
- Equities
- estimates
- exchange
- existing
- exponential
- exponential moving average
- extend
- Fall
- familiar
- Feature
- Figure
- finance
- FINANCE MINISTER
- First
- followed
- following
- from
- front
- gaining
- Gains
- GBP
- GBP/USD
- Global
- Global economy
- Half
- High
- higher
- holds
- How
- HTTPS
- in
- index
- Investors
- Jeremy Hunt
- Lack
- Last
- latest
- Line
- linked
- losses
- Lows
- manufacturing
- Manufacturing sector
- March
- MARKETWATCH
- meantime
- moving
- moving average
- needs
- news
- next
- next week
- orders
- pandemic
- plato
- Plato Data Intelligence
- PlatoData
- pmi
- pressure
- price
- Price Analysis
- Program
- provide
- purchasing
- Rate
- Rates
- relative strength index
- Relative Strength Index (RSI)
- remained
- remains
- Resistance
- rivals
- rsi
- S&P
- S&P Global
- sector
- Selling
- seven
- SIX
- slow
- Sources
- sterling
- street
- strength
- suffering
- support
- Tailwind
- Technical
- Testing
- The
- the UK
- time
- times
- to
- towards
- Trading
- treasury
- Tuesday
- Uk
- upward
- us
- US Dollar
- US Dollar Index
- US Treasury
- USD
- value
- Wall Street
- week
- weighing
- while
- will
- within
- worth
- would
- writing
- year
- yields
- zephyrnet